

Second Annual Release: The Arizona Budget Then and Now
Arizona Budget: Then and Now illuminates the change in Arizona state spending over the last twenty years.
During the 2023 legislative session, it is vital for citizens to be aware of the history of spending across the entire budget –the General Fund ($16 billion), and the approximately 1,200 Other Funds that spend another $47 billion.
A combination of economic volatility, record inflation, and unprecedented recent revenue growth – including a massive influx of Federal money since 2020 – create a unique opportunity for policymakers. The closest historical parallel may very well have been the Fiscal 2007 pre-Great Recession budget.
Methodology
The findings of this report are generated from the annual appropriations reports compiled by the Arizona Joint Legislative Budget Committee and the Governor’s Office of Strategic Planning & Budgeting staffs. These reports draw from each of the annual legislative bills, which authorize funding for each state department. The reports include appropriations from all funds including General Funds, Other Appropriated Funds, Federal Funds, and spending from Non-Appropriated Funds. In general, “spending” and “appropriation” are used synonymously for appropriated funds throughout this report, unless explicitly clarified.
Appropriated Fund: Legislatively mandated segregation of monies into separate funds, which are specifically subject to the annual Legislative appropriations process. The General Fund (GF) is the state’s largest Appropriated Fund, as opposed to Other Funds (OF).
Non-Appropriated Fund: Technically, these funds are statutorily appropriated and therefore not subject to the annual Legislative appropriations process. Subject to available fund monies and state law, an Agency may freely spend these monies.
Federal Funds: Amounts collected and made available to this state by the federal government, usually in the form of grants or matching entitlement funding. Though not subject to Legislative appropriation, the Legislature maintains some control over a subset of Federal Funds through the ‘expenditure authority’ process.
Cash Balance: The remaining, unexpended and unencumbered cash in a fund at the end of a fiscal year. Specifically, revenues minus expenditures plus beginning balance.
Structural Balance: The ongoing balance in a fund at the end of a fiscal year. Specifically, ongoing revenues minus ongoing expenditures. This is intended to reflect the long-term fiscal stability of a particular Fund (typically the General Fund).
Key Findings
- Since 2018, Arizona’s ongoing General Fund revenue growth has averaged 12.5% – versus just 3.8% for the five years prior
- Revenue Growth is being fueled by:
- Record inflation (taxes are generally tied to nominal measures)
- Structural changes in the tax code since 2017 – Tax Cuts & Jobs Act conformity, Wayfair remote sellers’ tax
- Growth will eventually slow down
- Revenue Growth is being fueled by:
- Ongoing spending growth over the same period averaged 5.1% – versus 2.7% for the five years prior
- Over the last ten years, real (inflation adjusted) K-12 education spending has increased by nearly $3.1 billion and today consumes nearly half of the States appropriated budget
- Despite a 17% increase in ongoing spending this year, the projected General Fund structural surplus will be approximately $2 billion – the sixth consecutive year of structural surplus and likely longest period of structural balance in state history
- Record revenues are not limited to the State General Fund – other funds (including local sales taxes, highway user gas and vehicle taxes, federal revenues, etc.) are all growing at record rates
- Given surging prices and a slowing economy, but record revenue collections and ahistorical fiscal optimism, the state faces significant budget uncertainty
- The FY2023 Enacted Budget spending plan would decrease General Fund spending in FY24 by $84 million
- The JLBC FY2024 Baseline Budget plan would decrease General Fund spending in FY24 by $47 million
- The Governor’s FY2024 Executive Budget plan would increase General Fund spending $1.6 billion
Annual Appropriations & Spending – Where It Goes How Much Money Does the Arizona State Government Spend?

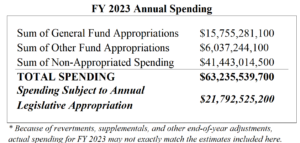
Source: JLBC Appropriations Report
Each year, the state’s legislature approves the General Appropriations Act – a single budget omnibus that dictates how most public revenue will be spent. The Legislature additionally approves dozens of individual spending and appropriations bills. While all public money generated by State taxes and fees is subject to appropriation, some funds are statutorily or continuously appropriated and not subject to the annual budget process. Federal and certain non-State monies are not subject to appropriation by the Legislature but may be subject to some statutory control.
State Government Revenues – Where It Comes From Flow of Tax & Non-Tax Revenue from the Source to State Agencies in FY22
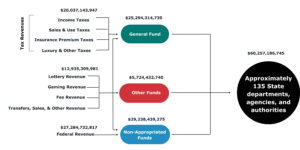
Source: State of Arizona Financial Transparency Portal, CSI estimates
The image above displays the flow of state revenue from the tax, fee or other revenue source to the state agency that is authorized to spend the revenue. There are many different types of state agencies, and many different types of revenue, and the Legislature ultimately determines who receives what. The flow above is intended to be generally illustrative only.
Critically, we hope this illustrates that a substantial volume of annual revenue (predominantly Federal funds but also including other non-State grants, gifts, and other sources) is not well captured in the existing annual budgeting and public oversight processes, and that over time a growing majority of spending and revenue occurs outside the General Fund.
Arizona Total Spending by Fund Type in FY03 & FY23
Total appropriations and estimated non–appropriated spending in FY23 is $63.2 billion. Over the last twenty years, the General Fund share of total spending has declined from over a third to only a quarter, while non-appropriated spending has increased from half to two-thirds of all spending. Average annual spending has grown at over 6%/year for the past two decades, versus approximately 5%/year growth in population and inflation.
Change in Real Total Spending Per Arizonan From FY03 to FY23
Since FY03, real spending per capita in Arizona has increased by over 56%. Most of that growth has occurred outside the General Fund, in Other Appropriated Funds and particularly in Non-Appropriated Funds.
Given most tax revenue flows to the General Fund, this implies Arizonans have enjoyed a relatively favorable State tax treatment over time but backfilled by an increasing reliance on non-tax fee and Federal revenues.
Change in Total Appropriations By Spending Area From FY03 to the FY24 Governor’s Budget Request
In terms of all funds – General Fund, appropriated and non-appropriated spending – nominal spending growth over the past decade has been concentrated in education, healthcare, and social services.
Change in State-Only Per Pupil K12 Funding in Arizona From FY17 to FY23
Source: JLBC K-12 Funding Report, JLBC FY2019 Appropriations Report, JLBC FY2023 Appropriations Report • Note: CSI assumes enrollment increases 0.2% in FY23 over FY22, and per-pupil formula funding increases 12%.
Real (inflation-adjusted) Per Pupil funding has increased 23% over the past five years, even as public-school enrollment has fallen dramatically. Since 2020 actual district school enrollment has declined by 31,604 students, while charter enrollment has increased by 11,941 students. Relative to 2019 JLBC Baseline projections, 2022 public school (district and charter combined) enrollment is over 65,000 students below pre-pandemic estimates.
Total Empowerment Scholarship Account
Enrollment Projections as of January
Source: JLBC FY 2024 Baseline Book, Executive FY 2024 Budget Request, CSI AZ K-12 Funding & Enrollment Changes • Note: CSI imputes an Executive ESA enrollment number by assuming a 4% baseline growth; they directly report enrollment in the Universal program only.
As of January, estimates of 2023 school year ESA enrollment range between 30,000 and 57,000 students. There were less than 12,000 students enrolled in the program during the 2022 school year, while there are approximately 1.1 million students enrolled in the state’s district and charter public schools. By law, ESA participants are entitled to 90% of the funding they would have generated under the state’s Equalization Formula (approximately $7,100 on average).
Change In General Fund Spending Since FY2020 By Education & All Other Funding Areas
Source: JLBC FY 2023 Appropriations Report, Governor’s FY 2024 Budget Request
Over the four-year period characterized by the Covid pandemic and associated uncertainty, the budget oscillated wildly – with periods of very limited growth (FY20 & FY22) followed by periods of substantial investment (FY21 & FY23). The FY24 Executive budget proposal falls in the latter box, increasing spending by about $1.3 billion or more than double the average over the prior four years ($584 million).
General Fund Revenue and Spending Growth From FY10 to the FY24 Governor’s Budget Request, including Ending Cash Balance
Source: JLBC FY 2023 Appropriations Report, Governor’s FY 2024 Executive Budget
Since FY18, General Fund revenue growth has exhibited rapid growth, far outpacing prior trends. While spending growth has increased as well, it has failed to keep pace , resulting in increasingly large General Fund cash surpluses. For example, for the 6-year period ending FY 23, average annual revenue growth was 10.9% – versus 9.0% average spending growth. This created the largest cash and structural surpluses in state history.
The Executive FY24 spending plan reverses this trend – growing spending by 10.3% even as projected revenues decline by –1.7%. For perspective, average annual spending growth over the prior 8 years (FY16-FY23) was 7.2%.
General Fund Structural Balance Over Time FY02 to FY24 Exec. Proposed
Source: JLBC FY 2023 Appropriations Report, Governor’s FY 2024 Executive Budget
For the first period since the Great Recession and the 5th consecutive year, the Arizona General Fund remains structurally balanced. Further, despite the change in administration, the Executive budget remains structurally balanced in all four reporting years, by its own reporting. This is a stark departure from prior practice, when structural balance was both not a regularly reported metric and not realized by actual or budgeted numbers for years. The FY 2024 budget recommendation grows ongoing spending by nearly 6.0% and reduces the structural surplus to its lowest level since FY 2017.
Structural balance is a powerful indicator of a state’s long-term fiscal health, because states whose ongoing spending commitments outpace ongoing revenues must reduce assets or accumulate new liabilities to maintain spending.
Annual Change in Spending Under the Prior Enacted & Executive Spending Plans
FY22 to FY24
Source: JLBC FY 2023 Appropriations Report, Governor’s FY 2024 Executive Budget
Under the FY23 Enacted budget plan, spending would increase by $2.3 billion in FY 2023, and then total spending would fall by ($84) million in FY 2024. While the enacted budgets out-year spending plan is a combination of spending reductions, out-year spending increases, and Baseline adjustments – none of which have been updated for this chart except a technical assumption related to Federal Medicaid match – we believe the FY24 spending decline accurately reflects policymaker intent at the time to moderate state spending following increases.
While the Baseline will need to be updated to reflect changes in K-12, Medicaid and other programmatic funding changes since last year, given the information available to CSI at this time, we cannot accurately speak to those numbers or the reasonableness of the JLBC or OSPB baselines. Policymakers should make understanding these numbers a focus of early budget discussions.
Proposition 123, Education Funding, and the State General Fund
Revenues Into – and Distributions From – the Highway User Revenue Fund Have Increased 44% Since 2013
Source: JLBC 2022 Tax Handbook
The Highway User Revenue Fund is one of the state’s largest non-appropriated Other Funds that is not Federally funded. Revenues are received from gasoline and vehicle taxes, and nearly 60% ($980 million) is distributed to local governments for road construction and maintenance.
While the Legislature eliminated (in part based on complaints from local governments) ‘HURF sweeps’ that removed approximately $60 million from local revenue shares, natural growth has added another $360 million in local revenues.
Since 2017, City Sales Tax Revenues Have Surged 61% and Added $2.0 Billion in Local Residual Revenues
Source: JLBC 2022 Tax Handbook, AZDOR Annual Reports
Arizona cities and towns rely primarily on municipal privilege, state shared income taxes, and state shared sales tax revenues for General Funds. Some but not all cities also levy a general property tax, and this share tends to be relatively small. For example, property taxes made up only about 6% of total revenue for the City of Phoenix in 2022.
Like the State General Fund, since 2017 city revenues have surged. Municipal sales tax collections have increased 61%; state shared revenues 35%; and the Wayfair remote sellers’ tax has exceeded budget forecasts by a factor of four. Relative to pre-2017 trends, the city revenue residual was over $2 billion by 2022.
Highlights of the Governor’s FY24 Budget Proposal
As the Legislature contemplates spending for FY23, it is likely to particularly consider elements included in the Governor’s proposal. We have identified the following elements as being noteworthy:
- $1.3 billion in new initiative spending. The Executive Baseline increase (+$37.1M) is the sum of both negative and positive adjustments, and difficult to disentangle.
- $90 million in new tax reductions – mostly targeted to selected households, they are unlikely to change the economic competitiveness of the state and should be evaluated on their policy merits.
- $150 million in one-time deposits for the Housing Trust Fund. This is one part of CSI’s recommendations for addressing the state’s housing crisis, and policymakers should consider it as part of a broader set of reforms.
- $666 million over two years to complete the $1 billion investment in Water security contemplated by the FY 2023 Enacted budget.