

Authors: Glenn Farley
Introduction
For over a year, Arizona’s Empowerment Scholarship Account (ESA) program has been open to any school-aged Arizona resident under its universal eligibility category. During that time, program enrollment has grown from 12,000 to 77,000 students. 51,000 of the new enrollees have been under the new universal category, implying 14,000 students were already eligible. Halo and reputational effects appear to matter for program enrollment.
While the ESA program now costs over $750 million, growth has slowed to lower levels than expected this time last year. That raises the question of why? And at the same time, why has traditional public school enrollment growth continued to slow, as well?
This report examines the demographic, behavioral, and financial trends for Arizona’s K-12 system since the pandemic, particularly through the lens of the ESA and growing demand for school choice over the last three years.
Key Findings
- During 2020, before the universal ESA expansion, nearly 50,000 students left Arizona’s District public school system. Even today, continued declines in District schools and slowing growth in Charter’s means total public school enrollment in Arizona is 34,000 students below 2019 levels and shrinking.
- Declining public school enrollments since 2020 reduced public K-12 funding formula costs by an estimated $450 million/year, and growing, compared to pre-pandemic trends. Since last year, the universal ESA program has returned these ‘missing kids’ to the public K-12 rolls – reinvesting prior ‘savings’ into education.
- Declining public school enrollment has coincided with growing private and homeschool enrollment. Private K-12 enrollment is about a third higher today than before the pandemic. This fueled rapid growth in ESA’s since September 2022 – which are on track to enroll over 77,000 students this fiscal year.
- Still, ESA enrollment growth is slowing, and at much lower levels than we expected last year. Demographic change is now reducing demand for all K-12 systems. The state’s largest kindergarten class was in 2012. CSI now estimates that Arizona’s school aged population peaked in 2021 and will decline by 40,000 students by 2028.
- Half of all School Tuition Organization (STO) dollars are reserved for low-income students, and based on zip code data, 80% of ESA families may be low- and middle-income. Combined with other data, these utilization rates suggest Arizona’s school choice programs support relatively high participation in private schooling by low- and middle-income families (compared to the average US state).
The Pandemic, Universal Expansion & ESA Enrollment
Since their creation in 2011, growth in Arizona’s Empowerment Scholarship Account (ESA) program has been relatively stable and independent of eligibility. Within only a few years of the program’s creation, over 20% of all Arizona K-12 students (more than 200,000 children) were probably eligible for an ESA award under at least one of the categories. Despite this, we estimate that there were only about 1,300 students enrolled in the program by 2014 (less than 1% of the state’s school-aged population).
Over the same period, enrollment by Arizonans in private schools was stable (according to NCES data, there were 48,000 students enrolled in private schools in 2018-19, versus 42,000 in 2009[i]). While School Tuition Organization’s (STO) are not required to directly report the number of students served, scholarship awards by the competing STO program did grow rapidly over the same period – from 26,000 scholarships awarded in 2009, to nearly 90,000 by 2019. Enrollment in Charter schools nearly doubled over the same period.
Figure 1
During the pandemic, enrollment in traditional schools – particularly traditional District public schools – collapsed. According to reports from the time, at peak up to between 1 and 3 million students nationwide couldn’t be accounted for in traditional school enrollment figures[ii]. In Arizona, District public school enrollment declined by more than 50,000 students during the 2020-21 School Year, while enrollment in the state’s Charter schools increased by only 12,000 and enrollment in traditional Private schools appears to have increased by about 11,000 students.
This movement leaves nearly 27,000 “missing kids” behind. Over the following two years, lagging data from the American Community Survey and other sources has found them – homeschooling in the United States doubled during the pandemic[iii] (to as high as 7 million families), while alternative “microschools” exploded in popularity – growing from a likely insignificant share of the American student population to 1-2 million students over the pandemic period, according to an estimate by EdChoice[iv]. Arizona’s long-more-popular STO program for funding private education was incompatible with this change; by law, a student receiving an STO scholarship must use it to pay tuition fees at a qualifying, traditional Private school. Total STO scholarships issued grew only about 2% during fiscal year 2021 (less than 2,000 more scholarships)[v].
Figure 2
In 2022, the Arizona Legislature passed, and then-Gov. Doug Ducey signed, HB 2853 – which created a new “Universal Eligibility” category for any school-aged Arizona resident. According to Department of Education reporting, the first participants under this category began enrolling in the ESA program in July 2022. Unlike with prior eligibility changes, interest and participation exploded – enrollment nearly tripled over the first 90 days following Universal Eligibility to more than 30,000 students[vi].
By the end of fiscal year 2023, enrollment reached 61,689 students; over 45,000 of those (73%) were enrolled under the Universal Eligibility category. Annual program awards had increased from $189 million to $587 million. The pandemics “missing kids” had again shown up on Arizona’s publicly-funded education rolls – but now as universal ESA recipients.
The program has continued growing over the first nine months of fiscal year 2024, but growth has slowed dramatically – while this was expected as the program began leaving its “catch-up” period and entered “steady state”, the level at which growth has begun to plateau (at 75,000-77,000 participants) is lower than anticipated.
Demographics and the “New Normal” of Declining Enrollment
Last year, CSI released a report that projected total ESA enrollment would reach approximately 100,000 students within 18-24 months of accepting Universal eligibility applicants (and 124,000 over five years). Now 21 months into the catch-up period of universal eligibility, program growth appears to be converging around 75,000 participating students.
Figure 3
Program growth averaged 4,130 students/month during fiscal year 2023; so far this year, program growth has averaged 1,700, and growth over the past three months has slowed again to approximately 1,500 students/month. JLBC now estimates that 75,207 students would enroll in the ESA program by the end of FY24; we now estimate enrollment will end the year at 77,570 students. For context, according to ADE, enrollment was 76,391 students on March 18th.
This raises an interesting question: what happened? Why has the program saturated at closer to 75,000 students, and what does this mean for the program’s growth prospects going forward?
The largest change since our initial estimate was the release of American Community Survey population estimates for 2022 and the 2018-2022 5-year averages late last year. According to Census Bureau estimates[vii], Arizona’s school-aged population (5–17-year-olds) peaked in 2021; in 2022 this age cohort shrank by 1.5% (-17,839 kids) – the largest decline on record for school-aged population in Arizona and a rate of decrease entirely unaccounted for in our projections. The Office of Economic Opportunity provides projections of state population growth by age[viii]; combining their most current forecast with the ACS-reported 2022 estimates provides a dramatic picture for Arizona’s future school-aged cohorts. Over the next decade, population decline will reduce the number of school-aged kids in Arizona by 42,000. Compared to prior trends and our prior estimates, by 2028 the gap is closer to 71,000 (compared to a counterfactual where population had instead grown slowly through 2028), which implies potentially smaller enrollment across all K-12 systems.
Figure 4
This revelation prompted us to review historical population and enrollment data. After all, how could such a dramatic demographic trend appear suddenly? It appears the answer is that demographic change has apparently moved slowly through the system – with growing upper classes masking declines in the lower classes. For example, while enrollment in District school Kindergarten programs fell nearly a quarter over the last decade, enrollment in District high schools actually increased 8% over the same period. According to the ACS, in 2010 there were 455,375 children under five in Arizona; in 2022 there were just 393,413 (-14%). There are now fewer young children to feed into the 5-17 school aged cohort than there once were, but it takes a decade or more for existing school-aged children to age out of the cohort. We can imagine declining birth rates moving through school systems like a wave; when Arizona Kindergarten classrooms peaked in 2012, this large class would then move from 1st through 12th grade, carrying that peak with them.
Tellingly, this peak class should exit the system sometime around now.
Historically, the public K-12 charge was a function of both the population aged 5-18, and the number of parents who chose traditional (District) public schools. That is not true today. Arizona began this departure in 1995 with its adoption of a Charter school system, but the private- and home-schooled population remained outside of state funding. When this population (outside the public funding formula) grew rapidly during and after 2020, that created an unexpected statewide revenue windfall. Universal ESA expansion effectively reinvests that windfall back into the education of K-12 students. After that reinvestment, public school formula funding commitments grow at the rate of school-age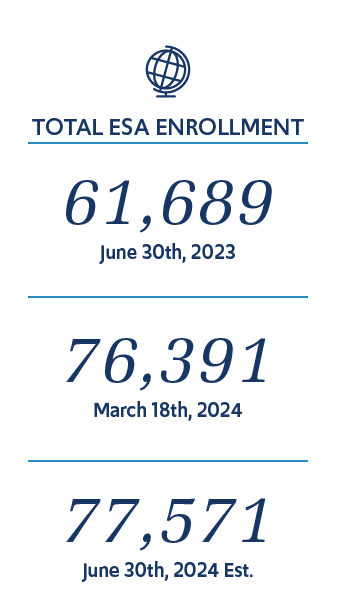 d population growth; the era of formula funding costs growing slower than population is likely over.
First-year Budget Impacts
After one year of open enrollment, the ESA program appears to be at or near its new steady state. During the catch-up period, enrollment grew from 12,127 students in June 2023 to 75,500 students by February 2024. Enrollment growth has now slowed; CSI projects that it will hit 77,571 students by June 2024 and the end of the current fiscal and school years.
Future enrollment in the ESA program will be a function of demographics (declining school-aged kids means fewer potential ESA participants) and choice (where students choose to enroll). Considered in totality, declining K-12 students suggests (subject to increases in formula or discretionary funding amounts) total public investment in K-12 funding is at or near a peak (potentially forever, depending on future trends), regardless; the operative question is what form the enrollments and payments will take (District, Charter, or ESA payments).
Differences in Per-Pupil Funding
Arizona now provides K-12 formula funding on a fully per-student basis; any 5 year old Arizona resident is likely eligible for at least one publicly funded option to pay for the costs of their primary education, regardless of where they attend. However, the amount of funding received varies significantly depending on that choice.
At the high end, a traditional District public school spending can expect to receive the equivalent of about $14,000 annually in taxpayer support. Of that amount, approximately half (~$7,000) is so-called “Equalization Formula” (Formula) funding – or funding required by the State to “equalize” funding across school districts, charters, and ESA’s.[ix] Notably, unlike other K-12 providers, local school districts are required to generate revenue to support their share of Formula costs via local property taxes (called the “Qualifying Tax Rate”), but the State General Fund is the payor of last resort – any leftover District Formula needs not raised by other sources are paid by the General Fund (or alternatively, at the margin effectively 100% of District Formula funding is General Fund for most districts and most of the time).
Charter school students receive approximately $12,000/year in taxpayer support. Of that amount, roughly two-thirds (about $8,000) is Equalization Formula funding. Most Charter school Formula funding is provided by the State General Fund.
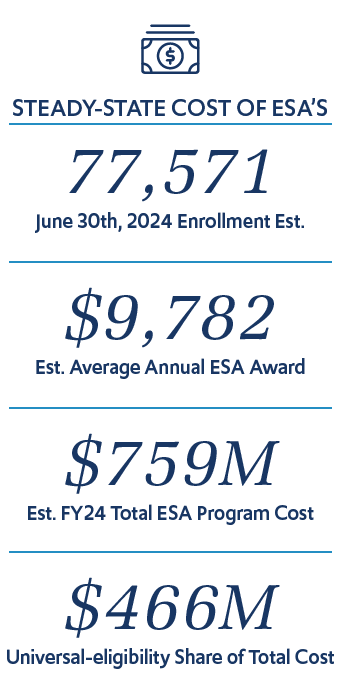
Empowerment Scholarship Accounts for most students are funded based on 90% of that students Charter Formula funding. According to ADE, the average Scholarship was $9,782 in September 2023. This is because the average ESA recipient is a different population than the average K-12 students (for example, about 16% of current ESA recipients have disability weighting, which increases their award amount)[x]. For an average Arizona K-12 student, though, the expected value of an ESA is approximately $7,100 per year. All ESA awards are paid for by the State General Fund.
Figure 5
Finally, School Tuition Organizations (STO’s) allow taxpayers to donate to a qualifying non-profit for the support of a private school student’s tuition costs. Individual credit-eligible donations are limited to about $650. In 2021, STO donations funded 98,135 private school scholarships worth $257.1 million (for an average scholarship of about $2,600). Notably, while data is available on the number and amount of scholarships awarded by STO programs, an individual student can receive multiple scholarships. Our best guess based on available data is that the average STO recipient receives between 2.2 and 3.1 scholarships (or an effective average award of about $7,800); this implies between 30 and 40 thousand Arizona students receive STO scholarships. STO support is effectively 100% General Fund equivalent.
Declines in Public School Enrollment
During 2020, Arizona’s traditional District public schools saw their largest recorded single-year enrollment declines. Approximately 50,000 students (on both an enrollment and unweighted ADM basis) left the state’s District schools between the 2020 and 2021 school years.[xi] Charter enrollment growth of 18,000 students was insufficient to offset these declines, and the students failed to return to their public schools in subsequent academic periods. As of October 1st, 2024, enrollment in District public schools is more than 52,000 students below its pre-pandemic peak.[xii] Note these enrollment declines predate universal ESA eligibility; we attribute them to the pandemic and student and parent responses to school policies implemented during it.[xiii]
Figure 6
Today total public K-12 enrollment (District and Charter) is 34,000 students below 2019 levels, for an average annual decline of about -0.8%/year. In January 2020, JLBC published its annual Baseline Book – which included the state’s “official” forecast of public school enrollment growth over the next three years. At the time, state budget officers were projecting average annual growth of +0.6% per year.
Because Arizona awards most public school funding on a per-pupil basis, these enrollment losses generate substantial taxpayer savings (including, as discussed above, State General Fund savings). Had enrollment growth ever since the pandemic been in line with the JLBC projections from early 2020, the state would be spending about $453 million more annually on K-12 formula costs than we are. Much – even most – would be new General Fund commitments, foregone by reduced public enrollment. Also of note: based on ACS population data, these declines predate the peak and decline in the 5-17 school aged population (see our Demographics section above), and instead were likely choice-driven. Demographic change may exacerbate this decline going forward.
Cumulative statewide savings from reduced public school enrollment over the last four years – assuming under the counterfactual that public school enrollment would have grown at an average rate of 0.6%/year – is over $1.2 billion dollars.
Steady-State Cost of Universal ESA Enrollment
At the end of FY 2023, the ESA program had 61,689 participating students; 45,157 were qualified under the Universal eligibility category. At an average annual award amount of $9,523, combined cost of the ESA program was approximately $587 million, of which $330 million was attributed to the cost of universal expansion.
As of mid-2024, enrollment in the ESA program has increased to 76,391 students. Growth has also slowed markedly; over the four weeks between February 26th and March 25th the program has averaged fewer than 300 new participants per week.
CSI now projects that the ESA program will finish FY 2024 with 77,570 enrolled students, and that it has exhausted its period of rapid “catch-up” growth. This reflects a lower level of steady-state enrollment than anticipated last year, and appears attributable to less demand for an ESA among “switcher” families (to the benefit of Charter schools and STO organizations, and potentially caused by the programs struggling administrative reputation) and fewer school-aged kids due to demographic change. Given 2022 ACS estimates and the December 2022 OEO population projections, CSI now estimates that there are up to 30,000 fewer school-aged kids in Arizona today than it projected based on pre-2022 ACS demographic trends.
In steady-state, total program cost this year is projected to be $759 million, of which $466 million will be attributable to the universal eligibility category. Strikingly, given this lower level of steady-state enrollment, the costs of universal eligibility only slightly exceed the statewide funding savings attributable to reduced public school enrollment since the pandemic. Given demographic declines, whether costs increase or decrease in the future (in steady-state) is no longer certain and will depend on the relative choices of remaining students between District, Charter, ESA, and STO options. These are discussed further in the Enrollment Projections section of this paper.
Implications of Universal ESA’s for Households & Private Schools
Generally, because of high tuition costs and the availability of robust public options, enrollment in private schools in the United States is relatively low and highly correlated with income. According to an analysis by Education Next, only about 8% of American schoolchildren were enrolled in private schools in 2014, and the private school enrollment rate among high-income American families (defined to be the 90th percentile) was roughly triple that of middle- and low-income families.[xiv]
Unlike many other states, the availability of a variety of mature choice options in Arizona pushes in other directions – potentially improving the accessibility of private education, particularly for middle-income families.
Figure 7
Arizona has one of the most robust Charter systems in the country and today 20% of all school-enrolled children are enrolled in an Arizona Charter school. The legacy ESA program (predating universal eligibility) was available to 20% or more of the state’s K-12 population.[xv] The state’s long-standing STO program provides about 100,000 scholarships annually to private school students, worth approximately $270 million; half of those awards are reserved for low-income students.[xvi]
Since mid-2022, participation in the ESA program has grown rapidly following universal eligibility. The Department of Education now also provides zip code data for ESA recipients, which enables us to better estimate the income range of these families using Census data. We now estimate that half of ESA recipients earn between $75,000 and $150,000 annually. The vast majority, in fact, are making less than $150,000 per year.
While it is difficult to precisely determine how many families of students in private school fall into this income range (since only about 60% of ESA expenditures go to private school tuition, and there is no way to know the relative incomes for those accounts specifically), between the ESA and STO income counts and expenditures data, it is reasonable to infer that today a substantial proportion of Arizona private-school-attending families are low- or middle-income.
We further assume that in the absence of this support many of these families would choose a Charter or other choice option, given the disproportionately high income of private-school-enrolled families elsewhere in the United States.
The Bottom Line
The ESA program has reached its steady-state, and rapid growth is likely fully behind it. Whether the program grows or not from here depends on the choices of students and parents, which further depends on how the program is perceived and how well it functions compared to the other K-12 options available in Arizona.
Demographic changes likely mean fewer school-aged children and lower overall enrollment across Arizona’s publicly funded K-12 options over the next ten years. And ultimately it is this demographic change, and pandemic-era changes in parental behavior that are changing K-12 in Arizona – and not-so-much universal ESA itself.
[i] “Elementary Secondary Information System: 2019-20 Private School Directory,” National Center for Education Statistics, Accessed March 2024.
[ii] Camp, Emma, “Millions of Students Went ‘Missing’ From Classrooms During the Pandemic. Many Haven’t Returned,” Reason Magazine, August 2023.
[iii] Eggleson, Casey, and Fields, Jason, “Census Bureau’s Household Pulse Survey Shows Significant Increase in Homeschooling Rates in Fall 2020,” U.S. Census Bureau, March 21, 2021.
[iv] McShane, Michael, and Diperna, Paul, “Just How Many Kids Attend Microschools,” EdChoice, September 12, 2022.
[v] “2022 Tax Handbook,” Joint Legislative Budget Committee, November 2022.
[vi] O’Brien, Teri, ”Empowerment Scholarship Account Program FY23 Quarter 1 Report,” Arizona Department of Education, September 2022.
[vii] “American Community Survey 2019: S0101 Age and Sex,” U.S. Census Bureau, 2019.
[viii] “Population Projections,” Office of Economic Opportunity, December 23, 2022.
[ix] Olson, Justin, “Arizona School Finance,” Arizona Tax Research Association, December 2009.
[x] “Arizona Empowerment Scholarship Account Program FY 2024 Quarter 1 Report,” Arizona Department of Education, January 6, 2024.
[xi] “FY21 Oct 1 Enrollment,” Arizona Department of Education, April 1, 2021.
[xii] “FY24 Oct 1 Enrollment,” Arizona Department of Education, October 2023. https://www.azed.gov/sites/default/files/2023/11/Oct1Enrollment2024_publish.xlsx
[xiii] Farley, Glenn, “Arizona K-12 Funding & Enrollment Changes Since FY2019”, Common Sense Institute Arizona, January 11, 2023.
[xiv] Lamb, Anne, Mbekeani, Preeya, Murnane, Richard, and Reardon, Sean, “Who Goes to Private School,” Education Next, July 17, 2018.
[xv] Farley, Glenn and Marsh, Whitney, “Redefining Accountability: A Path to Empowerment in Arizona’s ESA Program,” Common Sense Institute Arizona and Yes. Every Kid. Foundation, January 2024.
[xvi] “2023 Tax Handbook,” Joint Legislative Budget Committee, November 2023.