

Author: Zachary Milne
Introduction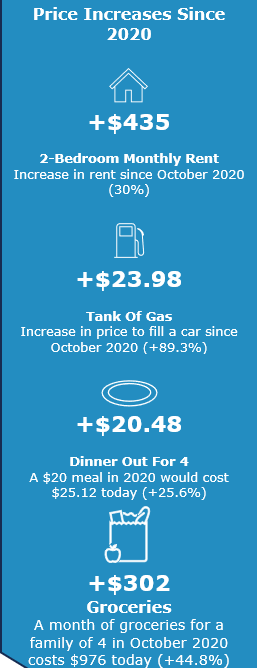
Inflation as measured by the Consumer Price Index (CPI) for the Phoenix metro area rose 2.6% year-over-year in April, an increase from 2.2% in February. This latest reading represents the 38th consecutive month of inflation above the standard target of 2.0% annually and represents a break from the trend of decreasing year-over-year inflation rates in the state that extended back to July 2022.
Between February and April, the CPI for the Phoenix area increased 1.9%, or an annualized rate of 12.0% (local inflation numbers are published every two months); the U.S. figure increased at a slower of 1.0% over the two-month span. However, national figures showed inflation falling slightly from 3.5% year-over-year in March to 3.4% in April. Headline inflation in the United States been anchored to just above 3% since June of 2023, and shows little sign of dipping below that level. The persistent inflation at the national level suggests that hopes of the soon-to-come monetary loosening should be tempered, with the possibility of further tightening in 2024 should inflation remain 70% above the Fed’s inflation target of 2.0%.
Shelter inflation – last year a significant driver of overall inflation in the Phoenix metro area – appears to have picked back up where it left off in 2023, increasing 1.8% in the two-month period between February and April, representing a red-hot annualized rate of 11.2%. Year-over-year, shelter costs in the Phoenix MSA rose 3.5%, well above the 2.7% year-over-year growth experienced in February. Prior months suggested shelter inflation in the Grand Canyon state may be normalizing after a turbulent three years for housing and shelter inflation, but the latest results suggest otherwise. However, it appears that other sub-categories are making up the lion’s share of inflation. The price index for all items less shelter costs rose 2.0% since February – an annualized rate of 12.5%.
This latest reading marks a cause for concern in the battle against inflation, particularly for those living in Arizona. Both the backwards looking year-over-year figures and more forward-looking annualized two-month growth figures show inflation in the valley rising quickly. And while previous readings could largely be attributed to persistent price struggles in the housing and rental markets, April readings suggest the inflation may be more widespread.
Prices in Metro Phoenix increased 1.9% (month-over-month) and increased +2.6% over the year (April ’23 through April ’24) – (BLS CPI Survey)
- Not only is inflation above the 2.0% target, but it is again accelerating in Arizona.
- Since the end of 2020, the typical Arizona household has had to spend a combined $34,078 more on food, housing, transportation, medical care, and other goods and services to buy the same stuff as they were buying three years ago.
- Had inflation instead run at 2%/year over the past three years, it would cost the typical Arizona family over $8,428/year less to purchase the same goods and services today.
- Even if the rate of inflation slows, it would take a sustained period of deflation to restore historical price levels.
- Inflation in metro Phoenix over the past 12 months (2.6%) remained lower than the national average (3.4%).
- Inflation excluding more volatile food and energy prices (so-called “core inflation”) is lower than overall CPI inflation, at 2.0% in the Phoenix area.
- Of the 23 urban consumer price indices tracked by the BLS in April, the Phoenix metro area had the lowest rate of measured inflation over the past year (backwards-looking) – a stark difference from 3rd highest in the month-over-month (real-time) figures, and again highlighting the extreme volatility of local prices since the pandemic.
- Despite sticky inflation, real incomes in Arizona appear to be rising – over the past 12 months (March 2023 to March 2024), average hourly wages have risen 4.2%, while prices have increased only 2.6%. However, keeping in mind longer-term rising prices, real wages in Arizona have fallen 1% since peaking in April 2020.