

Protecting Arizona’s Economic Competitiveness: the 2023 Arizona “Job Killers” List — July 2023
Author: Glenn Farley and Kamryn Brunner
Table of Contents
Introduction. 5
Key Findings. 5
The 2023 Arizona ‘Job Killers’ List. 9
Tax Increases. 10
Energy and Environmental Cost Increases. 12
Administrative and Legal Cost Increases. 13
Conclusion. 15
The Bottom Line. 15
Appendix 1: ‘Job Killers’ Bill List. 16
Appendix 2: ‘Job Killers’ Bill Impact Source List. 19
Introduction
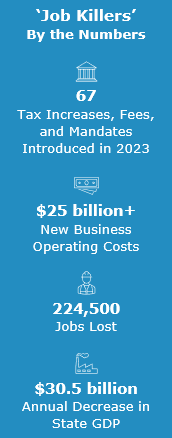
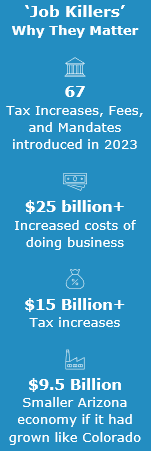 Every year in Arizona, legislators introduce hundreds of bills, most of which are never enacted. This year, the Arizona Chamber of Commerce and Industry (“Arizona Chamber”) identified 67 “Job Killer” bills which would have imposed substantial new taxes, costs, or administrative burdens on Arizona businesses. Ultimately, none of these bills were enacted, and the story has been similar for years. But this raises the question: what would happen to the state’s economy and business environment were some or even all these bills ultimately passed into law?
CSI Arizona has utilized the experience and research of our partners in Colorado to estimate the potential impacts on Arizona’s economic prospects of enacting some of the many policy ideas on this list. Bills like those studied here are being shopped at state legislature across the country, and many of them have been introduced annually at the Arizona Legislature. Though they have not moved in the past, the lesson of Colorado’s anti-business policy transformation over the past half decade shows that climates can change quickly.
Key Findings
- After growing faster than Arizona for years following the Great Recession, since 2019 and especially since the COVID recession, Colorado is now adding people, jobs, and GDP more slowly. Job growth in Colorado declined 67% over the past four years compared to the period 2015-2018.
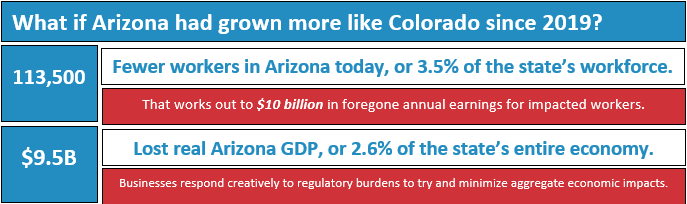
- Had Arizona followed Colorado’s employment and migration trends since 2019, it would have 113,500 fewer workers today and an economy 2.6% smaller ($9.5 billion in lost GDP). Instead, Arizona’s deliberate adoption of free market policies has given it some of the strongest growth in the country since the pandemic (especially in manufacturing).
- The 67 ‘Job Killers’ identified and tracked by the Arizona Chamber would have imposed over $25 billion in annual new costs on Arizona’s businesses, if enacted, including $15 billion in new taxes and fees – including the small businesses that are over 99% of firms.
A Tale of Two States
| Figure 1 |
Prior to the last half decade or so, Arizona and Colorado were on remarkably similar growth trajectories. Besides being regional neighbors, the two states in 1990 were peers in terms of population, economy, and political environment. That relationship would persist for nearly two decades. In 1990, Arizona had 3.7 million residents; Colorado was 10% smaller. By 2015 Arizona’s population had increased 86%; Colorado by a comparable 65%. Between 1990 and 2015 Colorado’s labor market would expand at an average rate of 2.1%/year, versus 2.4%/year in neighboring Arizona.
Similarly, Gross Domestic Product in the two states has historically shared comparable growth paths. The combined trials of the Great Recession (which was particularly hard on Arizona) and the American “fracking revolution” and commodity price surge (of particular value to Colorado with its rich supply of oil and gas) shifted Colorado’s growth trajectory relative to Arizona over the first 15 years of the 21st century. Between 2000 and 2015, Colorado’s real Gross Domestic Product grew at an average rate of 1.9%/year versus just 0.7%/year in Arizona. After 2015, though, something remarkable happens here and each state’s growth outlook shifts dramatically. Average annual output nearly quintuples to 3.2%/year, and since 2019, Arizona’s GDP has grown faster than Colorado’s (3.2% and 3.1%, respectively[i]).
| Figure 2 |
This raises a pair of intriguing policy questions: what happened in Arizona over the past decade or so to shift the state’s growth trajectory, both relative to the U.S. as a whole and its own historical standard? And similarly, why the apparent slowdown in Colorado’s growth prospects, particularly after 2019?
On the one hand, Arizona has aggressively invested in policy initiatives post-Great Recession intended to both diversify and make more competitive its business economy (and in particular its manufacturing economy). The beginnings of this can be traced to the states passage in 2011 of its “Jobs Bill”, which established the Commerce Authority and lowered business property and income tax rates. The 2017 federal Tax Cuts & Jobs Act ignited a nationwide surge in manufacturing employment and output growth, but its benefits disproportionately accrued to certain states, like Arizona (which went on to enact a 2.5% flat tax and cut property taxes on large business capital investments). By the late-2000’s, manufacturing employment in the United States had – for the first time in decades – stopped shrinking and started growing again, at an average rate of 0.8%/year since 2017. In Arizona, though, the rate of growth since then has been a remarkable 3.0%/year (faster in fact than overall employment growth in the state, meaning manufacturing is now a growing share of the state’s labor force).
| Figure 3 |
Colorado, for its part, went in a different direction. While the state conformed to the federal tax law changes in 2017, beginning in 2019 it has been enacting various statutory and regulatory schemes intended to promote social welfare ahead of economic growth (particularly in its manufacturing and oil and gas sectors – CSI Colorado has identified at least 22 new pieces of legislation enacted or considered since 2019 which impose additional costs and burdens on the states’ businesses)[ii]. After seeing manufacturing employment growth speed up to 1.8%/year after 2017, since 2019 Colorado’s manufacturing sector has slowed again and is now running at an average annual job growth rate of just 0.7%/year.
These new trajectories became particularly clear in the period immediately following the COVID-19 pandemic and its associated economic recession in early 2020. Economic activity experienced greater volatility during the first six months of 2020 than in recorded U.S. economic history. Massive job and output losses in the first quarter of the year in every state were offset in quarter two by massive recovery. However, since then, the U.S. and its fifty states have either fallen onto new (slower) post-pandemic trajectories or continued to exhibit faster-than-normal late-2010’s growth. Colorado is clearly one of the former; controlling for the pandemic in early 2020, it remains only about 15,000 jobs below its post-2019 job growth trend – meaning the state has largely recovered its pandemic-related job losses. Relative to its pre-2019 growth trajectory, though, Colorado is nearly 137,000 jobs short of trend (4.7% of its total labor). And its performance in sectors particularly sensitive to government policymaking (natural resource extraction, manufacturing, and healthcare, for example) relative to the performance of those sectors here is telling; growth there collapsed even before the pandemic took hold and has failed to recover since. Instead, over two-thirds of Colorado’s recent job growth is in professional business services – a category which includes lawyers, accountants, human resources professionals, and other support professionals that assist with regulatory compliance. Growth in the same sector in Arizona has barely outpaced the overall employment growth rate.
Arizona though, continues to add jobs at a rapid rate and – though growth may have begun to slow in more recent months – is still on pace to return to its late-2010’s job growth trend by the end of 2024. And the rate of job growth in its manufacturing sector since 2020 has been especially strong; CSI would reiterate here a point that has been made previously that then-Governor Ducey broadly designated the state’s manufacturing sector “essential” and prohibited from closure by state or local public health authorities[iii]. In some ways, in fact, pandemic-related disruptions appear to have driven rather than subdued
| Figure 4 |
some of Arizona’s new growth. Domestic in-migration, for example, surged during 2020 and has remained elevated since. For the first time since before the Great Recession, Arizona is averaging nearly 100,000 new domestic migrants annually – up from only about 50,000/year between 2010 and 2019[iv]. These domestic movers are fueling Arizona’s continued population growth even in the face of a continued demographic slowdown in natural births. Migration into Colorado, on the other hand, peaked in 2015 and has collapsed steadily beginning in 2019.
| Figure 5 |
Succinctly, since mid-2019 Colorado’s job growth has slowed by more than 60% relative to the four years immediately prior. This period of slower growth begins almost immediately following the state’s 2019 legislative session and its rapid subsequent enactment of numerous pieces of major regulatory legislation, including HB19-1261 (“climate action plan”), HB19-1004 (healthcare “public option”), and SB19-181 (oil and gas regulation) that year alone. The impact on certain key sectors of the state’s historical economy is telling – growth in the natural resources sector is approximately 3.4 times slower today than in the four-years prior to May 2019, and growth in its healthcare and manufacturing sectors is 86% and 50% slower, respectively.
Arizona’s overall average job growth, on the other hand, has slowed only 32% since mid-2019 (a slowdown concurrent with the pandemic, a global recession, and an overall slowdown in the U.S. economy over the past 18-24 months). And Arizona’s manufacturing job growth has actually accelerated over the same period. Had Arizona gone in another policy direction more comparable to that of neighboring peer Colorado, and its growth over the past four years mirrored there’s, CSI estimates that the state would have:
The 2023 Arizona ‘Job Killers’ List
 In partnership with the Arizona Chamber of Commerce and Industry, CSI Arizona identified 67 bills introduced during the 2023 Arizona regular legislative session that were either substantial tax increases, labor cost increases, new legal and administrative burdens, or other new fees and operating costs for Arizona businesses. Ultimately none of the bills on this list were enacted. However, the introduction and consideration of this and similar legislation is an annual exercise, and the trend (to consideration and passage from non-consideration) can change quickly. For example, in Colorado and since 2019, at least 13 similar sweeping regulatory bills like those identified this year by the Arizona Chamber have been enacted. Another half dozen or so are under active consideration, and while several more have failed, each year they or similar bills are re-introduced (and some end up ultimately enacted). To implement these legislative mandates, Colorado’s rulemaking agencies have created more than 10,000 new rules and administrative procedures in just the past half decade[v].
An initial econometric analysis using the Institute’s REMI simulation software suggests enactment of the 67 bills identified and tracked by the Arizona Chamber would have imposed at least $25 billion in new annual costs on Arizona businesses ($267 billion cumulatively over the next decade)[1]. These new costs could reduce Arizona employment by 224,500 jobs (-7.6%); reduce real per-capita personal income by over $2,600/year (-6.4%); and reduce real state Gross Domestic Product by $30.5 billion (-7.7%). Even enacting just a few of the introduced proposals, however, could have dramatic results for the state’s short- and long-run growth prospects. To reiterate: since 2019, Colorado has enacted only a handful of bills directly comparable to those introduced in Arizona and examined by CSI, but the change in its economic trajectory relative to Arizona is worth approximately 3.5% of this state’s workforce (over 113,000 jobs) and 2.6% of the state’s entire economy ($9.5 billion in real annual Gross Domestic Product).
Tax Increases
There was a total of 10 bills introduced during the 2023 legislative session that would create new or significantly increase existing taxes on individuals and businesses. CSI estimates the total tax increase would have been more than $15 billion. While most of these new taxes would fall on Arizona households and taxpayers, CSI estimates that approximately $6.4 billion would fall directly on businesses in the form of new investment and capital taxes, new sales taxes on business inputs, or direct taxes on new business activity. This category of tax increases includes 42% of new Transaction Privilege Tax increases[vi], new personal income taxes on capital gains and investments, the real estate transfer tax on investor purchases, and corporate income tax increases.

The largest tax increases of interest include:
Tax on net wealth over $50,000
$8.8 billion
SB1353 would have established an annual 1% tax on net wealth over $50,000, excluding the value of a primary residence. According to the Board of Governors of the Federal Reserve System, U.S. households had a net worth of nearly $140 trillion in 2022[vii]. Assuming 1.78% of that wealth is attributable to Arizonans, approximately half of households have a net wealth less than $50,000[viii], and that $728 million of that wealth is held in primary residences (based on the average value and number of owner-occupied residences in Arizona[ix]), the bill would subject approximately $882 billion in household wealth to the annual tax. In practice the bill would not raise nearly the revenue targeted; households would act to protect their assets from confiscation.
100% Tax Rate on Sales of Real Estate to Investors
$5.6 billion
HB2683 would have levied a real estate transfer tax equal to 100% of the sale value of a property on sales of real estate to “institutional investors”. According to the National Association of Realtors, 14% of residential home sales in Arizona in 2021 involved institutional buyers[x]. Given Zillow data on volume and value of Arizona home sales, CSI estimates that the universe of sales subject to the 100% tax could be approximately $5.6 billion. This should be regarded as an imprecise estimate given the uncertainty around what qualifies as an institutional sale, and that the proposed tax rate would function more as a ban on investor purchases than a revenue-generating tax.
1% Sales Tax on Services
$689 million
HB2735 would have levied a new 1% statewide Transaction Privilege Tax on sales of services in Arizona. Under current law, most services are exempt from the sales tax. The Department of Revenue’s Tax Expenditure Report provides an annual estimate of the value of various deductions from the sales tax base – including for most services[xi]. According to a 2020 study by Ernst & Young, approximately 42% of all sales taxes fall on business inputs[xii].
Additional bills with components that increase state taxes and fees are identified in the full table of ‘Job Killers’ that accompanies this report.
Labor Cost Increases
There were a total of 15 bills introduced during the 2023 legislative session and identified by the Arizona Chamber as imposing new costs or mandates on how employers and employees interact. While 13 of these bills would impose indeterminate new costs on employers, one would impose substantial and quantifiable changes on the long-term structure of Arizona’s labor market: a repeal of right-to-work, which has been Arizona law since 1947. Bills considered and rejected by the Arizona legislature this year would pre-empt negotiation over broad swathes of the employer-employee relationship, including work schedules, when an employee could be categorized as exempt and salaried versus hourly, what medical and leave benefits must be provided, and more. If enacted, evidence from other neighboring states (California, Colorado, New Mexico, and others) tells us these requirements could dramatically slow employment and productivity growth in Arizona. CSI Colorado has identified over a dozen new employment-related regulatory policy changes created since 2019[xiii].
Repeal of Right-to-Work
$18.6 billion
HB2110 would have repealed Arizona’s 70-year-old right-to-work law, which gives workers the freedom to choose whether to join a labor organization at their new employer. In states without such protections, labor unions can require employers to operate “closed shops”: the employer agrees to hire only union members. A 2021 Harvard study notes “states with Right-To-Work (RTW) laws have experienced higher employment and population growth than states without such laws”[xiv]. CSI assumes – based on this and other similar research – that repeal of right-to-work in Arizona would after ten years reduce the manufacturing share of employment by 3.2%; reduce overall employment by 1.6%; and reduce economic migration by 0.11%. Using the REMI simulation software[xv], CSI estimates HB2110 would have reduced Arizona’s employment by 3.9% and real Gross Domestic Product by 4.0% in 2033 (relative to its baseline). By imposing between $15 and $18 billion in new costs on Arizona businesses, the repeal of right-to-work is estimated to have the single largest negative economic impact of any of the approximately 15 proposals specifically quantified by CSI.
Family Medical Leave Coverage
Increased benefit & compensation costs
HB2130 would have provided mandator family and medical leave benefits for up to 26 weeks of paid time off for employees of covered employers in Arizona, due to certain family events. While CSI did not conduct a specific analysis of this proposal, similar programs in other jurisdictions have imposed significant new direct costs on both employers and employees to fund the leave programs, and indirect costs in terms of reduced compensation and lower employment. For example, a study by CSI Colorado estimated the cost of that states new mandators family leave program at $1.3 billion annually[xvi].
“Fair” Schedule Standards
Increased benefit & compensation costs
HB2766 and SB1345 would have imposed new scheduling requirements on employers, including mandatory minimum payments for scheduled hours (regardless of actual time worked). Such rules are relatively novel –the first “fair scheduling” law was enacted by San Francisco in 2015, and the first statewide requirement was passed by Oregon in 2018. Because these rules are relatively new and not widely adopted, quantifying the economic impacts is difficult. However, a similar bill considered this year in Colorado would have increased the costs of doing business by up to $5,000 per covered employee[xvii]. For context there are more than 3.1 million workers in Arizona.
Additional bills with components that increase labor and hiring costs are identified in the full table of ‘Job Killers’ that accompanies this report.
Energy and Environmental Cost Increases
Of the 67 bills tracked by the Arizona Chamber, CSI identified 7 as dealing with energy and environmental regulation. Of those, three have seen similar proposals enacted in Colorado since 2019 – reflecting both how new this trend is at state legislatures and the rapidity of adoption of some of these proposals following their introduction and consideration. In aggregate, it is estimated that nearly 2% of Gross Domestic Product is spent on compliance with existing state and federal environmental protection regulation[xviii]. A meta-analysis of 12 Colorado statewide energy and environment policies enacted or considered since 2019 identifies approximately $1 billion in new annual compliance costs for that state’s businesses, and Colorado has created at least 55 new energy and environmental regulatory policies since 2019[xix].
Private Right of Action
Increased legal & litigation costs
SB1691 would make it easier to bring civil lawsuits against an Arizona business when alleging a violation of the state’s environmental laws and administrative rules. Environmental and climate litigation is a growing risk for American employers. According to an analysis by the Harvard Law School, U.S. “climate litigation” suits have surged from virtually none before 2005 to nearly 140/year as of 2020[xx]. According to Law Street Media, there were 954 federal lawsuits under “environmental matters” in 2019[xxi]. In this litigious environment, statutory changes to ease the bringing of state civil actions represent a significant legal risk.
Energy Use Measuring and Reporting
Increased administrative costs
SB1363 is an Arizona legislative attempt to join a national trend in enacting new state-level energy auditing and reporting requirements on commercial structures. These laws tend to impose substantial new administrative burdens on affected businesses for little clear benefit. For example, CSI Colorado’s analysis of the similar HB21-1286 identified approximately $3.1 billion in compliance costs over the next 27 years.
Additional bills with components that increase environmental and energy regulation are identified in the full table of ‘Job Killers’ that accompanies this report.
Administrative and Legal Cost Increases
Finally, CSI identified 17 of the ‘Job Killing’ bills as imposing new legal and administrative compliance burdens on Arizona businesses. These mandates range from making it more difficult for utility companies to disconnect service for non-paying customers, to banning short-term-rentals, to capping residential rents.
Rent Control
Increased housing costs
SB1484 would cap annual increases in rent at 10% over the prior year for most residential units in Arizona. After largely disappearing from state and local policymaking after being discredited in the 1970’s, “rent control” policies have enjoyed a recent resurgence. However, there is broad economic consensus – going back decades – that these policies are especially destructive to affected rental markets and tend to reduce both the quality and supply of available housing[xxii].
Wrongful Termination Litigation
Increased legal & litigation costs
SB1619 would have loosened existing restrictions on when and how terminated employees can bring wrongful termination lawsuits against their former employers, in cases where the alleged violation is already covered procedurally under Arizona law (e.g., in cases of an alleged civil rights violation).
Additional bills with components that increase legal and administrative costs are identified in the full table of ‘Job Killers’ that accompanies this report.
Mandatory “Cash Pay”
Increased administrative costs
HB2555 would have required Arizona retailers with at least one “physical location” to accept cash for payment on transactions of less than $100. The introduction of this bill in Arizona follows a national trend of states considering and enacting mandatory cash payment options (including Colorado in 2021[xxiii]). However, these well-intentioned mandates often fail to consider the tradeoffs inherent in a business’s decision to accept (or not) any form of payment, particularly on the margin.
Accepting cash is not costless. A business must purchase cash counting and storing equipment; hire staff to transport the staff from the business to its bank for deposit; account for losses due to accidental or deliberate mishandling; and account for the cost of the additional time required to process cash transactions. According to one industry study, administrative costs of accepting cash range from 4.7% to 15.3% per transaction, depending on the size and efficiency of the business’s cash operation. For context, credit carding processing fees typically range from 1% to 3%[xxiv], and cashless pay options (like Square) typically charge fees in the 3.5% range.
Further, recall these are average costs. At the margin, costs can be much higher. A business traditionally set up to handle only cash transactions could have very high marginal costs associated with beginning to accept a small number of relatively low-dollar credit card transactions. Conversely, a business handling only cashless payments newly required to accept cash faces thousands of dollars in startup and ongoing costs to process (potentially) very few net new cash transactions – it must purchase new equipment, devote time to staff training and security and compliance, and develop new account relationships with its financial partners. Policymakers should consider that no business decision is made in a vacuum and no successful business deliberately excludes a potential customer.
Healthcare “Public Option”
Increased healthcare costs
Last introduced in 2019 but a perennial policy consideration, HB2347 would have opened Arizona’s Medicaid program (AHCCCS) to enrollment by otherwise ineligible individuals. Under current law, Arizona shares the cost of Medicaid with the Federal government, and the terms of that cost-sharing require that Arizona limit enrollment only to eligible low-income individuals pursuant to state and federal regulations. Medicaid was not intended to be a substitute for employer-sponsored or marketplace-provided private insurance for most working adults – amongst other things, its reimbursement rates are typically much lower than comparable private insurance[xxv], and it provides access to a relatively smaller pool of providers in most markets[xxvi]. Instead, it primarily insures the very low-income nonelderly, and lower-income elderly and child populations (though it also covers approximately half of all births in the United States).
Expanding eligibility to the general consumer without regard for statutory eligibility risks attracting middle-income adults otherwise eligible for private insurance, because Medicaid typically has much lower out-of-pocket costs than commercial coverage. This in turn reduces the insurable pool for private insurers and businesses, reducing their revenue and potentially driving up costs. This also presents risks to providers – who must either accept the lower Medicaid reimbursement rates, discontinue acceptance of Medicaid patients, or increase charges on its cash-pay and commercially insured populations.
An analysis of Colorado’s 2021 “public option” plan found that it would cost providers and hospitals between $830 million and $1 billion per year[xxvii]. And according to a recent report by coloradopolitics.com, four national health insurance firms have exited the Colorado market in just the past year – reducing consumer options and shifting costs onto an ever-shrinking market[xxviii].
Conclusion
Every year, the Arizona Legislature considers hundreds of bills. Many – including the 67 identified by the Arizona Chamber – are never sent to the Governor for signature, despite an almost annual exercise in introduction of identical or very similar ‘Job Killing’ bills. Given that, it is easy to assume that these policies could never become law. Unfortunately, though, the rapid adoption of dozens of similar bills in Colorado since 2019 (and the subsequent slowdown in that state’s economic growth) is a strong warning against complacency.
Policymakers should be aware of the potential economic impacts – had Arizona grown like Colorado since 2019, Arizona would have 130,000 fewer jobs today and their economy would be 2.6% smaller.
The Bottom Line
Policy matters. Policymakers should carefully consider the costs of new rules and regulations on their businesses and economy, rather than looking only at expected benefits.
Appendix 1: ‘Job Killers’ Bill List
Appendix 2: ‘Job Killers’ Bill Impact Source List
Arizona Board of Regents, Enrollment Report Fiscal Year 2023, https://www.azregents.edu/sites/default/files/reports/2023_fall_enrollment_report.pdf
Arizona Department of Revenue, Fiscal Year 2022 Annual Report, https://azdor.gov/sites/default/files/media/REPORTS_ANNUAL_2022_ASSETS_fy22_annual_report.pdf
Arizona Department of Revenue, The Revenue Impact of Arizona’s Tax Expenditures Fiscal Year 2022, https://azdor.gov/sites/default/files/media/REPORTS_EXPENDITURES_2022_fy22-preliminary-tax-expenditure-report.pdf
Board of Governors of the Federal Reserve System, Households Net Worth, https://fred.stlouisfed.org/series/BOGZ1FL192090005Q
Board of Governors of the Federal Reserve System, Survey of Consumer Finance, https://www.federalreserve.gov/econres/scf/dataviz/scf/chart/#series:Net_Worth;demographic:nwcat;population:1,2,3,4,5;units:mean;range:1989,2019
IRS, Individual Income and Tax Data by State and Size of Adjusted Gross Income, https://www.irs.gov/statistics/soi-tax-stats-historic-table-2
IRS, Sales of Capital Assets Reported on Individual Tax Returns, https://www.irs.gov/statistics/soi-tax-stats-sales-of-capital-assets-reported-on-individual-tax-returns
Joint Legislative Budget Committee, 2022 Tax Handbook, https://www.azjlbc.gov/revenues/22taxbk.pdf
Joint Legislative Budget Committee, Fiscal Note on SB1164 2011, https://www.azleg.gov/legtext/50leg/1r/fiscal/sb1164.doc.pdf
National Association of Realtors, Impact of Institutional Buyers on Home Sales and Single-Family Rentals, https://cdn.nar.realtor/sites/default/files/documents/2022-impact-of-institutional-buyers-on-home-sales-and-single-family-rentals-05-12-2022.pdf?_gl=1*r6fo0c*_gcl_au*MzY2OTU1MDI1LjE2ODU3MzIzODE.
U.S. Census Bureau, 2021 American Community Survey 1-Year Estimates, https://data.census.gov/table?q=DP04&g=040XX00US04&tid=ACSDP1Y2021.DP04
Zillow Housing Data, The Sales Count Nowcast, https://www.zillow.com/research/data/
Zillow Housing Data, Median Sale Price, https://www.zillow.com/research/data/
[1] CSI’s analysis was limited to the 12 bills that directly increase taxes or fees in Arizona, repeal right-to-work, and increase the minimum wage. The fiscal impacts of these specific proposals were either readily identifiable (in the case of direct tax and fee impacts), or generally quantifiable using existing academic research (in the case of minimum wage increases and the repeal of right-to-work). The remaining proposals would impose additional costs and increase the estimates included here but are not readily and reliably quantifiable.
[i] “GDP by State”. Bureau of Economic Analysis, March 31, 2023.
[ii] Sias, Lang, “Assessing Colorado’s Economic Competitiveness: Mounting Cost of Labor and Environmental Policy”. Common Sense Institute, April 18, 2023.
[iii] Governor Ducey, “Executive Order 2020-12 Prohibiting The Closure of Essential Services”, Arizona Office of the Governor, March 23, 2023.
[iv]“Migration/Geographic Mobility”, U.S. Census Bureau, Accessed June 6, 2023.
[v] “State RegData” Mercatus Center, 2020.
[vi] “Total State and Local Business Taxes”, Ernst & Young, October 2020.
[vii] “Financial Accounts of the United States”, Federal Reserve System, March 9, 2023.
[viii] “Survey of Consumer Finances”, Federal Reserve, December 9, 2022.
[ix] Housing Data” Zillow, Accessed June 6, 2023.
[x] “Impact of Institutional Buyers on Home Sales and Single-Family Rentals”, National Association of Realtors, May 2022.
[xi] “The Revenue Impact of Arizona’s Tax Expenditures Fiscal Year 2022”, Arizona Department of Revenue, November 15, 2022.
[xii] “Total State and Local Business Taxes”, Ernst & Young, October 2020.
[xiii] Sias, Lang, “Assessing Colorado’s Economic Competitiveness: Mounting Cost of Labor and Environmental Policy”. Common Sense Institute, April 18, 2023.
[xiv] Austin, Benjamin & Matthew Lilley, “The Long-Run Effects of Right to Work Laws”, Harvard University, November 16, 2021.
[xv] “REMI Tax-PI”, REMI, Accessed June 6, 2023
[xvi] Strunk, Lisa, Chris Brown & Erik Gamm, “Proposition 118: A Statewide Paid Family and Medical Leave Program for Colorado but At What Cost?”, Common Sense Institute, October 21, 2020.
[xvii] Ryan, Tamra & Chris Brown, “HB23-1118: Fair Workweek Employment Standards: Understanding the Impacts of Mandating Scheduling Predictability in an Unpredictable Business”, Common Sense Institute, February 16, 2023.
[xviii] Pizer, William & Raymond Kopp, “Calculating the Costs of Environmental Regulation”, Resources for the Future, March 2003.
[xix] “New Energy Laws & Regulations to Comply with HB19-1261 Climate Action Plan to Reduce Pollution Since 2019”, Common Sense Institute, March 6, 2023.
[xx] Mishra, Subodh, “The Rise of Climate Litigation”, Harvard Law School Forum on Corporate Governance, March 3, 2022.
[xxi] Ashcraft, Emily, “Analytics: Environmental Matters Over the Last Two Years”, Law Street Media, January 18, 2021.
[xxii] “Rent Control in the United States”, Wikipedia, Accessed June 6, 2023.
[xxiii] Manuel, Obed, “Your Money Is Good Here: Colorado Retailers Must Soon Accept Your Cash As Payment, Or Face a Penalty”, CPR News, May 12, 2021.
[xxiv] Daly, Lyle, “Average Credit Card Processing Fees and Costs”, The Ascent, March 9, 2023.
[xxv] Mann, Cindy, “How Differences in Medicaid, Medicare, and Commercial Health Insurance Payment Rates Impact Access, Health Equity, and Cost”, The Commonwealth Fund, August 17, 2022.
[xxvi] “Medicaid Networks More Than 60% Narrower Than Commercial in Some Areas”, Avalere, March 11, 2021.
[xxvii] Brown, Chris and Gamm, Erik, “Third Time Is No Charm”, Common Sense Institute, March 25, 2021.
[xxviii] Goodland, Marianne, “Fourth health insurance company to leave Colorado”, coloradopolitics.com, June 21, 2023.