

Author: Zachary Milne
The Arizona Budget Then and Now
Arizona Budget: Then and Now illuminates the change in Arizona state spending over the last twenty years.
During the 2024 legislative session, it is vital for citizens to be aware of the history of spending across the entire budget –the General Fund ($18 billion), and the approximately 1,200 Other Funds that spend another $47 billion.
After several years of double-digit spending growth, the state is now facing a deficit exceeding $800M in the current fiscal year. Further deteriorating tax revenues – a nation-wide phenomenon – will put additional strain on policy makers during the 2024 legislative session.
Methodology
The findings of this report are generated from the annual appropriations reports compiled by the Arizona Joint Legislative Budget Committee and the Governor’s Office of Strategic Planning & Budgeting staffs. These reports draw from each of the annual legislative bills, which authorize funding for each state department. The reports include appropriations from all funds including General Funds, Other Appropriated Funds, Federal Funds, and spending from Non-Appropriated Funds. In general, “spending” and “appropriation” are used synonymously for appropriated funds throughout this report, unless explicitly clarified.
Appropriated Fund: Legislatively mandated segregation of monies into separate funds, which are specifically subject to the annual Legislative appropriations process. The General Fund (GF) is the state’s largest Appropriated Fund, as opposed to Other Funds (OF).
Non-Appropriated Fund: Technically, these funds are statutorily appropriated and therefore not subject to the annual Legislative appropriations process. Subject to available fund monies and state law, an Agency may freely spend these monies.
Federal Funds: Amounts collected and made available to this state by the federal government, usually in the form of grants or matching entitlement funding. Though not subject to Legislative appropriation, the Legislature maintains some control over a subset of Federal Funds through the ‘expenditure authority’ process.
Cash Balance: The remaining, unexpended and unencumbered cash in a fund at the end of a fiscal year. Specifically, revenues minus expenditures plus beginning balance.
Structural Balance: The ongoing balance in a fund at the end of a fiscal year. Specifically, ongoing revenues minus ongoing expenditures. This is intended to reflect the long-term fiscal stability of a particular Fund (typically the General Fund).
Key Findings
- Despite soaring revenues over the last three fiscal years, state tax receipts have begun to decline even after accounting for tax cuts and other policy adjustments – aligning with broader trends across the nation.
- After growing by nearly 14% per year from 2019 through 2022, ongoing revenues are poised to fall 3.8% (6.6%) in FY24 according to estimates from the FY25 Executive Budget (FY25 JLBC Baseline). This follows a 5.9% decline in FY23.
- Due to unforeseen deterioration in revenues and a FY24 budget that contemplated a razor-thin ending balance, policy makers are facing record deficits estimated to reach over $2.3 billion by FY27 according to JLBC FY25 Baseline projections.
- One-time spending now comprises roughly 18% of total spending, compared to just over 6% in years past. This marked shift from budgeting norms has allowed policy makers to implement dramatic spending increases while at the same time showing structural surpluses on paper.
- In the last decade real (inflation adjusted) K-12 education spending has increased by nearly $3.5 billion and today consumes nearly half of the States appropriated budget.
- The Governor’s FY25 budget proposal revises FY24 spending down by over half a billion through a combination of baseline caseload adjustments and ex-appropriation of FY24 and earlier appropriations – FY25 spending in the Governor’s budget remains largely flat relative to the Enacted Budget due to similar reductions.
- If policy makers had kept General Fund spending at 4.2%/year beginning in FY23 – the average spending growth between FY12 and FY22 – the state would be facing cash surpluses instead of record deficits.
- We estimate that policy makers could have increased spending by 7.7% each year after FY22 and still faced a positive General Fund cash balance of over $200M in FY27.
Annual Appropriations & Spending – Where It Goes
How Much Money Does the Arizona State Government Spend?
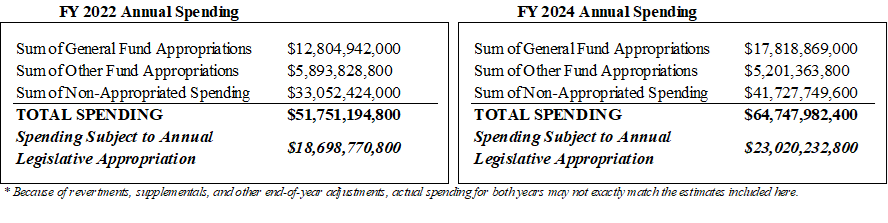
Each year, the state’s legislature approves the General Appropriations Act – a single budget omnibus that dictates how most public revenue will be spent. The Legislature additionally approves dozens of individual spending and appropriations bills. While all public money generated by State taxes and fees is subject to appropriation, some funds are statutorily or continuously appropriated and not subject to the annual budget process. Federal and certain non-State monies are not subject to appropriation by the Legislature but may be subject to some statutory control.
State Government Revenues – Where It Comes From
Flow of Tax & Non-Tax Revenue from the Source to State Agencies in FY23
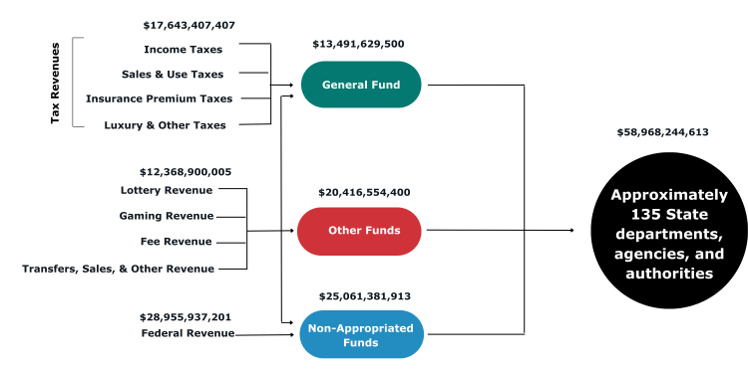
The image above displays the flow of state revenue from the tax, fee or other revenue source to the state agency that is authorized to spend the revenue. There are many different types of state agencies, and many different types of revenue, and the Legislature ultimately determines who receives what. The flow above is intended to be generally illustrative only.
Critically, we hope this illustrates that a substantial volume of annual revenue (predominantly Federal funds but also including other non-State grants, gifts, and other sources) is not well captured in the existing annual budgeting and public oversight processes, and that over time a growing majority of spending and revenue occurs outside the General Fund.
Arizona Total Spending by Fund Type in FY04 & FY24
Total appropriations and estimated non–appropriated spending in FY24 is $64.4 billion. Over the last twenty years, the General Fund share of total spending has declined from over a third to roughly quarter, while non-appropriated spending has increased from half to two-thirds of all spending. Average annual spending has grown at over 5.4%/year for the past two decades, versus approximately 5%/year growth in population and inflation.
Change in Real Total Spending Per Arizonan
From FY04 to FY24
Since FY04, real spending per capita in Arizona has increased by 60%. Most of that growth has occurred outside the General Fund, in Other Appropriated Funds and particularly in Non-Appropriated Funds.
Given most tax revenue flows to the General Fund, this implies Arizonans have enjoyed a relatively favorable State tax treatment over time but backfilled by an increasing reliance on non-tax fee and Federal revenues.
Change in Total Appropriations By Spending Area
From FY04 to the FY25 Governor’s Budget Request
In terms of all funds – General Fund, appropriated and non-appropriated spending – nominal spending growth over the past decade has been concentrated in education, healthcare, and social services.
State-Only Per Pupil K12 Funding in Arizona
From FY17 to FY24
Real (inflation-adjusted) Per Pupil funding has increased 34% over the past five years, even as public-school enrollment has fallen dramatically. Since 2020 actual district school enrollment has declined by 18,000 students, while charter enrollment has increased by over 15,000 students. Relative to 2019 JLBC projections, 2023 public school (district and charter combined) enrollment is over 80,000 students below pre-pandemic estimates.
General Fund Revenue and Spending Growth From FY15 to the FY25 Governor’s Budget Request, including Ending Cash Balance
Two years of rapid revenue growth coupled with increasing but manageable expenditures led to the largest General Fund cash surpluses in state history. However, drastic spending increases in FY23 and FY24 – averaging over 17% according to the JLBC Baseline – erased over $4.7 billion in cash surpluses.
The Governor’s FY25 budget proposal reflects a positive ending balance in FY25 of $134 million – contrasted with a Baseline estimate that contemplates a $1.7B deficit. The Executive achieves a positive balance through a series of fund transfers and ex-appropriations, coupled with more optimistic revenue projections.
One-Time General Fund Spending as a % of Total Spending, FY15 – FY25 (Exec. Budget)
Historically, lawmakers relied very little on one-time spending, as this category made up only 2%-3% of total General Fund spending between fiscal years 15 and 19. However, beginning in FY20 the State deviated sharply from this trend, enacting one-time spending that exceeded 16% of total spending, and averaged over 11% between FY20 and FY24. Including the large revenue diversions in FY23, one-time spending averaged nearly 14% of total spending through this time.
This shift allowed drastic increases in spending while remaining structurally balanced on paper.
Counterfactual General Fund Position Limiting Spending to Average Growth FY12-FY22 (4.2%)
Overall General Fund spending growth remained limited through most of the last decade but began increasing drastically starting in FY21.
Growth averaged a modest 4.2% between FY12 and FY22, despite large increases in FY19, FY20, and FY21. However, even with the large uptick in spending through FY22, policy makers could have increased spending by 7.7% per year – nearly double the FY12-FY22 spending average – and still ended with a positive cash balance through the current budget window.
Annual Change in Spending Under the Prior Enacted & Executive Spending Plans
FY22 to FY24
Under the FY24 Enacted budget plan, spending would increase by $2.1 billion in FY 2024, followed by reduction of $1.6 billion in FY25.
The FY25 Executive Budget proposal increases spending by a more modest $1.6 billion in FY24 through a combination of supplemental caseload reductions and ex-appropriations of FY24 and earlier appropriations. The FY25 Executive increases FY25 spending $38 million above the levels contemplated in last year’s enacted budget.
Since 2017, City Sales Tax Revenues Have Surged 61% and Added $2.0 Billion
in Local Residual Revenues
Arizona cities and towns rely primarily on municipal privilege, state shared income taxes, and state shared sales tax revenues for General Funds. Some but not all cities also levy a general property tax, and this share tends to be relatively small. For example, property taxes made up only about 6% of total revenue for the City of Phoenix in 2022.
Like the State General Fund, since 2017 city revenues have surged. Municipal sales tax collections have increased 76%; state shared revenues 70%; and the Wayfair remote sellers’ tax has exceeded budget forecasts by a factor of four. Relative to pre-2017 trends, the city revenue residual was over $2.7 billion by 2023.
Highlights of the Governor’s FY25 General Fund Budget Proposal
As the Legislature contemplates spending for FY25, it is likely to particularly consider elements included in the Governor’s proposal. We have identified the following elements as being noteworthy:
- $500.5M in new initiative spending. The Executive Baseline decrease (-$2.1B) is the sum of both negative and positive adjustments, and difficult to disentangle.
- $244.3M reduction for ESA reform which would limit universal eligibility to students who attended a public school for at least 100 days prior. This is estimated to drop the total ESA population in FY25 by 67%, or 55,000 students.
- $100M in one-time funding for the Child Care Assistance program at the Department of Economic Security to provide child-care assistance to parents with incomes at or below 165% of the Federal Poverty Level.
- $300M reduction in planned FY25 deposits into the Long-Term Water Augmentation Fund. The FY 2023 budget contemplated three one-time deposits into the fund, with the third and final deposit planned for FY 25. The Executive Budget reduces this deposit to $33M from the planned $333M.