

Jim Kolbe Free Enterprise Fellowship
Brandon Bloch is CSI Arizona’s Jim Kolbe Free Enterprise Junior Fellow. He graduated Summa Cum Laude with a B.A. in Political Science from Arizona State University. He has interned in a U.S. Congressional District Office performing constituent services. He has also acted as a junior fellow for an ASU professor, assisting with research and publications. He is passionate about developing and applying policy solutions that cross ideological and party lines
About the Jim Kolbe Free Enterprise Fellowship
Inaugurated in 2023, the Jim Kolbe Free Enterprise Fellowship provides strong compensation for foremost policy experts to research key issues affecting the Arizona economy such as international trade, finance, appropriations, tech excellence, commerce, and more.
A Junior Fellow, a current college student, will be hired as well. They must be of exceptional promise, aspiring to become an unwavering community leader and dedicated public servant that relentlessly advocates for sound policies that promote economic prosperity.
About the Author(s)
Glenn Farley is CSI Arizona’s Director of Policy & Research, where he leads its research efforts. Glenn has helped CSI provide accurate, timely, and insightful public information on issues ranging from tax and regulatory policy, to Arizona’s changing K-12 landscape since the pandemic.
Prior to joining CSI in 2022, Glenn ended his 8 years in the Office of the Arizona Governor as Gov. Doug Ducey’s Chief Economist and a policy advisor. In that role he advised on issues of tax, fiscal, and regulatory policy, and was one of the Governor’s lead architects of his two major tax reforms – the 2018 tax overhaul that established the State’s first remote sellers sales tax and dedicated the proceeds to a major simplification and overhaul of the individual income tax, followed by the 2021 income tax omnibus which phased in a 2.50% flat tax (the lowest in the country). Mr. Farley has also led the budget team that produced the Executive revenue forecasts and caseload spending numbers that have helped ensure the longest run of conservative, structurally balanced budgets in State history.
Zachary Milne is CSI Arizona’s Senior Economist and Research Analyst. Prior to joining CSI, Zachary served as an economist and budget analyst for the Arizona Governor’s Office of Strategic Planning & Budgeting. In this capacity he developed the state’s revenue forecasts, and advised a team of budget analysts on the creation of K-12 and Medicaid caseload figures for the State’s annual budget. He also advised the Executive policy and leadership teams on fiscal policy, and regularly presented detailed analyses on each of the dozens of tax bills introduced in the Arizona Legislature each year. Originally from upstate New York, Zach’s then-active-duty service with the United States Air Force brought him to Arizona, where he has remained. Zachary is currently also a member of the Arizona Air National Guard.
We thank Declan Quinn, Research Analyst Intern, for his excellent research assistance.
Tom Simplot supported this report as a reviewer. The role of the reviewer is to help vet the accuracy of specific language, terminology, and data used in the report from the perspective of the reviewer’s professional experience. They are neither spokespersons nor authors of this report.
Tom Simplot is former director of the Arizona Department of Housing and a longtime member of the Phoenix City Council. Tom’s career in housing has spanned several decades as an attorney, former real estate agent and former owner of affordable rental properties in Arizona. Tom is also past president of the Maricopa County Board of Health and the Maricopa County Industrial Development Authority.
About Common Sense Institute
Common Sense Institute is a non-partisan research organization dedicated to the protection and promotion of Arizona’s economy. CSI is at the forefront of important discussions concerning the future of free enterprise and aims to have an impact on the issues that matter most to Arizonans. CSI’s mission is to examine the fiscal impacts of policies, initiatives, and proposed laws so that Arizonans are educated and informed on issues impacting their lives. CSI employs rigorous research techniques and dynamic modeling to evaluate the potential impact of these measures on the Arizona economy and individual opportunity.
Teams & Fellows Statement
CSI is committed to independent, in-depth research that examines the impacts of policies, initiatives, and proposed laws so that Arizonans are educated and informed on issues impacting their lives. CSI’s commitment to institutional independence is rooted in the individual independence of our researchers, economists, and fellows. At the core of CSI’s mission is a belief in the power of the free enterprise system. Our work explores ideas that protect and promote jobs and the economy, and the CSI team and fellows take part in this pursuit with academic freedom. Our team’s work is informed by data-driven research and evidence. The views and opinions of fellows do not reflect the institutional views of CSI. CSI operates independently of any political party and does not take positions.
Forward
For several years, CSI Colorado spent hundreds of hours developing a sound methodology to better understand and quantify the homelessness issue – first in Colorado and now in Arizona. Over the past six months, CSI Arizona has spent considerable time reviewing hundreds of annual reports, financial statements, budget documents and IRS informational returns based on this approach. We have also engaged several local stakeholders and subject matter experts.
There is a deep commitment from leaders in the public, private, and nonprofit sectors to address homelessness and a lot of innovative and effective approaches helping to transform lives. Based on feedback from these conversations, CSI has taken extra steps to refine its data.
The report is not intended to criticize but rather to bring a critical eye to the issue with a transparent lens on the funds being spent to address the issue. There is a need to think about how we coordinate our homeless services and how we prioritize and spend finite resources to maximize impact. This report is a clear look at a snapshot of how much our state is spending at a specific point in time to address the issue. We know there are many ways to look at this problem and this report focuses on only one way and only for a specific moment. That is the specific lens we elected to take only to try and provide additional data insight for use by the public and policymakers as we continue working to solve this crisis.
Table of Contents
Authors: Glenn Farley, Zachary Milne, and Julie Katsel 1
With contributions from Brandon Bloch and Declan Quinn. 1
Jim Kolbe Free Enterprise Fellowship. 2
About the Jim Kolbe Free Enterprise Fellowship. 2
About Common Sense Institute. 4
The Increasing Social Costs of Homelessness. 9
Children Experiencing Homelessness. 11
Sheltered vs. Unsheltered vs. Permanently Housed. 12
Homelessness Related Spending. 14
Appendix B: Methodology & Data Notes. 20
Appendix C: Full List of Charitable Organizations. 23
Summary & Key Findings
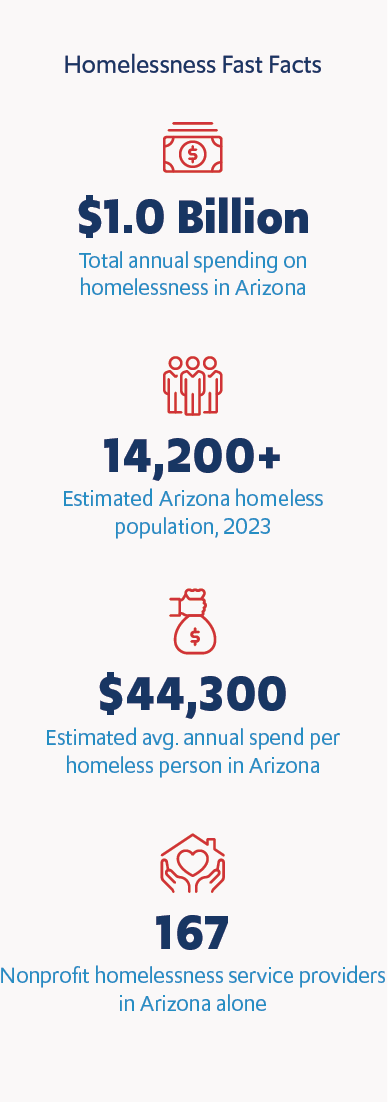
Homelessness – and the provision of related services – has evolved into a substantial economic sector. While services are primarily provided by nonprofits, funding starts at the federal level and flows from federal, state, and local grantors into the nonprofit space. The funding and services are distributed through a vast national network of local nonprofit organizations, with Arizona alone hosting as many as 167 such entities. CSI estimates that the total nonprofit workforce dedicated to alleviating homelessness in Arizona is as high as 51,000 employees and volunteers. For context, the state’s largest private organization employs about 45,000 people[i].
CSI estimates that statewide spending in Arizona is approximately $933 million to $1.1 billion annually on shelter, treatment, food, and other support services for people experiencing homelessness. According to the latest Point-in-Time counts, today there are more than 14,000 (Estimate 1, Appendix B) people experiencing homelessness in Arizona, and another 9,600 estimated to be in Permanent Supportive Housing.
This means that Arizona through various government and nonprofit providers spends between 88% and 284% of the median annual rent for a home or apartment in the Greater Phoenix area on every homeless person. Despite this substantial financial commitment, the homeless population has not only failed to diminish over the past decade but has, in fact, increased in size.
- Over the last three years, Arizona’s homeless population has increased nearly 30%. Today, there are approximately 24,000 (Estimate 2, Appendix B) people in Arizona either homeless or in permanently subsidized housing intended for those who would be homeless but-for the support (‘housing first’). This estimate may also underestimate the true total homeless population. Experience gathered by CSI Colorado for a similar homeless report suggests that true populations may exceed PIT counts by a factor of 2.5 (see Appendix B).[ii]
- The unsheltered homeless population nearly tripled between 2014 and 2023, while the population dependent on Permanent Supportive Housing (PSH) programs grew by a third. Some data suggests that growing resources and a focus on providing housing at any cost have not only failed to reduce the homeless population but may have exacerbated problems sheltering the most vulnerable, including any transitory population and the HUD Category 1 “literally homeless” not in permanent units.
- Homelessness-related service providers are a growing industry. In Arizona today, CSI has identified at least 167 nonprofit and public entities spending an estimated $933 million to $1.1 billion per year directly combatting homelessness – or up to $47,200 per homeless person, every year. Homelessness-related services now employ the equivalent of 9,000 people. Including another 42,000 part-time volunteers, this industry would be roughly the size of the state’s entire mining and logging sector in terms of annual workhours[iii]. Put another way, homelessness spending exceeds half the gross domestic product (GDP) of the entire farming industry in the state[iv].
- A record 7,600 homeless people went without shelter in 2023. Today, there are 20% fewer shelter beds available in Arizona than there were in 2007, despite statewide average spending per homeless person being nearly double the median annual rent.
Introduction- A Growing Problem
| Figure 1 |
The official 2023 numbers – released in December– were the worst ever recorded for people experiencing homelessness in the United States[v]. In Arizona, the homeless population increased to 14,237 people (+5% year-over-year); another approximately 9,601 are in “Permanent Supportive Housing” (PSH) and arguably part of an indigent and dependent population though not literally homeless. According to HUD data, this is the largest recorded dependent population in Arizona since at least 2007 and it is the state’s largest literally homeless population since 2010[vi]. Since 2020, the state’s literally homeless population has increased nearly 30%; in Pima County the increase is over two-thirds compared to the COC’s 2020 population.
The homelessness situation in Arizona represents one of the most pressing public health and humanitarian concerns facing the state[vii]. People experiencing homelessness – relative to the population overall – are more likely to have addiction issues and use drugs and alcohol[viii]; more likely to be convicted of a crime, including violent crimes and felonies[ix]; and have significantly higher mortality rates[x].
| Figure 2 |
Across the United States, homelessness increased by 12% between 2022 and 2023. Relative to this national trend, Arizona’s increase was slower. However, it’s essential to examine this figure in a longer context. Prior to this, between 2020 and 2022, Arizona witnessed a significant and concerning surge in homelessness (up more than a third in just three years). There appears to have been a break in the state’s homeless population trends during and after the pandemic, particularly in the two urban counties. This break arrested the prior trend of flat or even a slowly declining unhoused population (offset somewhat by a simultaneous increase in the population in permanent supportive housing). Between 2019 and 2022 Arizona had the 8th fastest rate of growth in its homeless population in the country. The Phoenix metropolitan area – the state’s urban core – today has the 8th largest homeless population among all regions tracked by the federal Department of Housing[xi].
While a relatively slower increase in Arizona last year might indicate some progress in addressing the acute crisis within the state, overall population levels remain significantly higher than historical norms even as federal, state and local financial resources have surged. The increasing unsheltered population estimates have been coincident with other negative social outcomes as well. Crime, addiction issues, and overdoses are rising both nationally and in Arizona[xii]. Educational outcomes and K-12 performance are declining (particularly for certain populations and demographics also at higher risk of being homeless, being convicted of or victims of crime, etc.)[xiii]. These outcomes are occurring despite record public investment in these areas; arguably never has the disconnect between financial resources and policy outcomes been more stark than it is today following the pandemic and its associated fiscal profligacy.
Zooming in, the Maricopa County Continuum of Care (COC) last year documented a literally homeless population of 9,642 individuals, marking a 6.8% rise compared to the figures from 2022. This occurred alongside a 4.4% increase in the number of people estimated to occupy PSH units[1][xiv]. Meanwhile, the Pima County COC reported that 2,209 people were experiencing homelessness in 2023 – a decline of 0.8% from a year earlier. However, once estimates for the number of people in PSH units are added, the total homeless or would-be homeless population increased 1.7%. In the Balance of State COC, 2,386 homeless individuals were counted – a 3.74% increase from the previous year. Including the PSH population increases this year-over-year growth to 16.1%.
| Figure 3 |
The Increasing Social Costs of Homelessness
The rate of deaths among individuals experiencing homelessness is increasing at a faster pace in Arizona than the rate of homelessness itself. Moreover, there is a notable uptick in the proportion of these deaths attributed to drug-related causes.
According to data from the Pima County Medical Examiner, there were 223 recorded deaths among individuals experiencing homelessness in Pima County during the year 2023. This represents a significant surge compared to the 179 deaths reported in 2022, marking an increase of 24.58% within just one year.
In 2022, drug-related deaths accounted for 49.16% of the 179 recorded cases in Pima County. In contrast, in 2023, drug-related deaths constituted an even higher percentage, with 60.99% of the 223 cases attributed to drug-related causes.
The Maricopa Medical Examiner reported a substantial rise in cases involving individuals experiencing homelessness in 2022, totaling 732 cases—an alarming 42% increase compared to 2021. Among these cases, 63% were linked to drug-related factors, 23% were heat-related, and 18% were categorized as “drug and heat-related.” Notably, methamphetamine was the primary cause in 80% of these cases (369), while 306 cases were attributed to fentanyl-related deaths[xv].
These trends underscore the urgent need for comprehensive measures to address not only homelessness but also the complex challenges surrounding substance abuse among this vulnerable population.
| Figure 4 |
In our 2022 report, Fentanyl, Crime, and Arizona’s Southern Border, CSI presented an alarming conclusion regarding the economic costs of the fentanyl crisis in Arizona. It revealed that these costs had escalated to a staggering $53 billion in 2021. This figure represents a remarkable 250% increase since 2010, significantly surpassing the previous CDC estimate of $21.8 billion produced in 2017. These costs encompass a wide spectrum, including those associated with substance abuse treatment, law enforcement efforts, healthcare expenses, and the reduction in overall productivity.
Efforts to reduce the abuse of prescription opioids have been successful; unfortunately, the subsequent surge in the supply and demand for fentanyl and other synthetic substitutes for prescription pills has created a new social problem. Because of the nature of the two communities (both those experiencing homelessness and those with addiction issues), it is difficult to compile good and reliable data on causal interactions between homelessness, drug use, and addiction. Anecdotally, however, reports suggest the rise of fentanyl and increased social tolerance for open drug use is at least coincident with the rising struggle with homelessness national and in Arizona[xvi] [xvii] [xviii]. While studies differ on their estimates of the share of the homeless population that is dependent on drugs, mortality data suggests the difference is stark – based on Medical Examiner data, we estimate that 81% of deaths in people experiencing homelessness were drug-related, versus approximately 21% of overall deaths[xix].
Beyond drug-use related deaths, homeless individuals are more often the victims of violent crime, including homicide. For example, studies suggest the rate of violence victimization among people experiencing homelessness ranges from 14% to 21%[xx], versus an estimated 2.3% for the population overall[xxi].
Moreover, these problems are not limited to the homeless populations themselves, but often spill over in to neighboring areas[xxii]. According to the Cicero Institute, neighborhoods next to large groups of unhoused individuals also report higher levels of armed robbery, rape, and aggravated assault[xxiii]. The higher incidence of crime among homeless populations also contributes to monetary losses among nearby businesses, as customers choose to avoid these stores due to fears over crime[xxiv].
This unfortunate reality was illustrated recently in a 2023 Superior Court of Arizona case (Brown v. City of Phoenix), a suit concerning a homeless encampment covering 15 city blocks in the downtown Phoenix area and commonly referred to as “the Zone”. One of the primary complaints by the plaintiffs – comprised mostly of businesses located within the confines of “The Zone” – concerned the “dramatic” increases in property crime, and general lack of safety imposed by the nearby encampment. Regular break-ins, both during and after hours of business, led to costly repairs and constant replacement of locks and other security equipment. Moreover, the suit alleged that the local businesses “experienced a dramatic decrease in customers and foot traffic to their businesses and a decrease in the value of their properties that corresponds to the increase in homeless encampments in the Zone[xxv].”
Since litigating the issue, the City of Phoenix has – by its own reporting – “cleared” the Zone[xxvi]. Notably, it did so without changes to the adequate temporary or permanent shelter and housing counts, and while also facing a separate federal lawsuit seeking to prevent it from engaging in these kinds of clearings (under existing 9th Circuit precedent)[xxvii].
Children Experiencing Homelessness
Arizona demonstrates a positive trend in the reduction of child homelessness, standing in contrast to the national picture. While there was an overall increase in the number of children experiencing homelessness across the country from 2022 to 2023, the situation in Arizona took a different turn. According to the 2023 Point-in-Time data, there were 1,585 individuals under the age of 18 who were identified as homeless, marking an encouraging 8% decline compared to the 2022 count, which had totaled 1,723 minors.
| Population Under 18 Experiencing Homelessness in Arizona | ||
| 2019 | 2022 | 2023 |
| 1,602 | 1,722 | 1,585 |
Sheltered vs. Unsheltered vs. Permanently Housed
Federal grantmaking is a dominant driver of state and local homelessness policy. According to the White House, federal agencies made more than $10.3 billion in funding available for homeless assistance in FY 2024 – the vast majority of which flows to state and local governments in the form of grants. Arizona’s share of this funding would be approximately $200 million, and according to our estimates, over a quarter of all homelessness-related nonprofit revenue in Arizona came from government sources.
| Figure 5 |
Government grant awardees are required to use their funds in a manner consistent with the agency’s rules, objectives, and performance metrics. For at least the last 25 years, the federal government has perceived homelessness as primarily an affordable housing problem, and its policy response has been focused on “Housing First” as a priority among Permanent Supportive Housing polices[xxviii]. As a result, nonprofits and state and local government agencies have similarly focused their homelessness-related efforts on providing housing solutions.
To fill these units – and as the name implies, create a population of technically not homeless though potentially still dependent on permanent or longer-term public support – policymakers removed various behavioral obligations, like requirements that participants try to find jobs or abstain from using drugs.[xxix]
These policies have been both expensive, and – particularly since 2020 – have failed to demonstrably reduce homelessness. Since 2014, the total number of PSH units in Arizona – i.e. units for “housing first” initiatives – increased by a third, while the unsheltered homeless population is estimated to have nearly tripled. At the same time, reports suggest these policies have resulted in rampant abuses in both the PSH[xxx] and literally homeless[xxxi] populations. Moreover, studies suggesting there are savings from shifting homeless populations onto permanent housing programs like PSH – by way of reduced consumption of homelessness-related services – note that those reductions were often offset by the increased cost of the permanent housing intervention, at best, rendering such interventions a “break-even proposition”[xxxii].
| Figure 6 |
In 2023, the total number of individuals experiencing homelessness in Arizona reached 14,237 according to PIT counts, with an approximate 9,601 additional individuals being supported through PSH. However, within this overall PIT count, 7,615 people, or 53.54%, were categorized as unsheltered. Unsheltered individuals – also referred to “sleeping rough” – are those who find themselves residing in locations not intended for human habitation and represent the most vulnerable individuals experiencing homelessness. In contrast, the sheltered homeless – excluding those in PSH or other more long-term programs – are accommodated in emergency shelters, transitional housing, or safe-haven programs, and typically experience lower levels mortality and victimization[xxxiii].
| Figure 7 |
Within Maricopa County specifically, the COC reported a total of 9,642 individuals experiencing homelessness based on PIT counts. Among this population, 4,908 individuals, representing 50.9%, were identified as unsheltered homeless. It is noteworthy that this percentage marked a decrease of 2.41% from the 53.13% of individuals who were unsheltered in 2021.
The Pima County COC documented 2,209 individuals experiencing homelessness in 2023 based on PIT counts. Particularly noteworthy is that out of this total homeless population, 1,501 individuals, amounting to 67.90%, were identified as unsheltered. Comparatively, in 2022, 60.07% of the homeless population in Pima County were classified as unsheltered.
The Balance of the State COC documented a total of 2,386 homeless individuals in their 2023 report, indicating a 3.74% increase when compared to the figures from 2022. Among this homeless population, 1,206 individuals were categorized as unsheltered, constituting 50.59% of the overall homeless count. This marked a 10.59% decrease in the percentage of individuals identified as unsheltered compared to the previous year.
| Figure 8 |
Despite seeing a rise in this more vulnerable homeless population over the last three years, the state has only marginally increased the number of available shelter beds (to 7,569 this year from 6,568 in 2019); shelter bed counts are down nearly 20% since 2017. Consistent with ongoing federal priorities, PSH unit counts remain at all-time-highs following 10+ years of rapid growth.
Homelessness Related Spending
Even as the homelessness problem worsens, taxpayers are allocating increased resources to address it. For example, total grants provided by HUD to nationwide grantees totaled $37.7 billion in 2020-2022, representing a 56% increase from ten years ago (2010-2012). However, the total grant amounts for Arizona during this timeframe increased 154% according to HUD data[xxxiv].
Although not all HUD issued grants are for the purpose of addressing homelessness specifically, most, if not all programs, directly relate to homelessness such as affordable housing development and preservation, homeownership, rental assistance, and other supportive housing and services.
| Figure 9 |
At the state government level, initiatives funded through the state’s General Fund with the specific purpose of addressing homelessness have increased dramatically in just the last two years. A brief review of the State’s budget documents for fiscal years 2022 through 2024 shows that funding labeled with the explicit purpose of combating homelessness increased 16-fold, from $2.7 million in FY22 to $47.5 million in FY24[xxxv] [xxxvi].
A more comprehensive estimate of all the resources going towards the alleviation of homelessness requires the examination of all levels of government spending on homelessness – Federal, state, and local – along with those expended by the endless number of nonprofit organizations operating within the state. CSI identified 167 nonprofit organizations and 34 government agencies tasked with administering programs and direct support for those experiencing homelessness in Arizona. These 167 nonprofit organizations alone employed 9,003 people and had an estimated 42,054 volunteers. In terms of full-time employment hours, this total nonprofit workforce dedicated to alleviating homelessness in Arizona roughly equates to the size of the state’s mining and logging industry in terms of annual worker hours.
| Figure 10 |
Overall, CSI estimates that total Federal, state, local, and private funding to support individuals and families experiencing homelessness in Arizona reached between $933 million and $1.1 billion annually between 2020 and 2023. Based on high and low estimates of both the total and literally homeless populations (see Appendix B), this spending equates to between $20,700 to $47,200 in annual spending per homeless and would-be homeless individual (PIT and PSH populations), and $22,000 to $66,500 for each literally homeless individual (just PIT population).
| Figure 11 |
Put another way, the total per-capita spending in Arizona to alleviate homelessness ranged anywhere from 88% to 284% of the median yearly rent for all property types in the Phoenix metro area[xxxvii].
The support provided by these agencies extends well beyond the provision of housing. For example, CSI identified 40 nonprofit agencies operating within the state whose primary mission involves the provision of food and/or clothing. This subset of the nonprofit homelessness industry alone spent an estimated $147 million in Arizona between 2021 and 2022. These additional services extend to addiction related services and treatment, financial support, counseling, education, behavioral health care, transportation, services to pets, and HIV assistance.
Interestingly, only a marginal fraction of overall spending is dedicated to substance abuse programs – despite extensive data suggesting the incidence of addiction issues are much higher amongst people experiencing homelessness than other populations. Specifically, substance abuse treatment appears to be less than 1/50th of identified total resources expended by nonprofit organizations for housing and shelter, and only 1/100th of all spending on homelessness relief efforts, despite being the most significant cause of death among the homeless population.
On the other hand, the dominant expenditure activity CSI identified for nonprofits providing homelessness services was housing and shelter.
This finding aligns with the broader shift in homelessness relief efforts in recent years consistent with ‘housing first’ and similar federally-driven policies prioritizing shelter ahead of other treatments and interventions. According to the National Alliance to End Homelessness, “Housing First does not mandate participation in services either before obtaining housing or in order to retain housing[xxxviii]”, despite the fact that 78% of the unsheltered homeless self-report a mental health condition, 75% report a problem with substance abuse, and at least 50% report a problem with both conditions[xxxix].
At the root of these policies is the belief that homelessness is a phenomenon driven primarily by a lack of housing or access to shelter. However, the simultaneous expansion of both the unsheltered population and the participants in ‘housing first’ programs over the past 15 years presents an obstacle for those touting the efficacy of such programs. Furthermore, self-reports by those experiencing homelessness and who remain unsheltered illustrate the problem with the lack-of-housing explanation for homelessness – more than half contribute their mental health or substance abuse conditions to their loss of housing in the first place[xl].
| Figure 12 |
Gaps in the Estimate
While we have tried to capture all of the identifiable direct expenditures on homelessness and related services by state and local government and Arizona nonprofits, this should not be regarded as a complete estimate of all related spending in this state.
Specifically, we have not attempted to estimate indirect costs – like law-enforcement and public safety expenditures, healthcare costs, and other indirect expenditures. For additional details on what we haven’t included here, see Appendix B.
Additionally, though, even direct expenditures by relevant organizations may be missing. For example, it is often difficult to specifically delineate what line items within a given budget – be it for a public organization like a city government, or a nonprofits financial reporting – is homelessness related. CSI engaged various stakeholders, including city and state budget officers, for their feedback on our data collection efforts. Various parties agreed that because homelessness spending is a novel and growing space, current reporting is not always clear and this makes it more difficult to track; that reporting may improve in the future, which in turn would improve these estimates.
The Bottom Line
Measured in both human and economic costs, the homelessness crisis in Arizona has reached alarming levels. The state’s experience in the last decade – particularly after the pandemic – points to a concerning trend of decreasing or even negative returns on investment for dollars spent on alleviating homelessness. Despite now spending $1 billion+ annually and employing over 9,000 people and 42,000 volunteers in an ever-expanding nonprofit industry dedicated to relieving homelessness in Arizona, the unsheltered homeless population in the state has nearly tripled since 2014.
The relationship is clear – an emphasis on treating homelessness primarily as a housing problem has resulted in a massive increase in the population in permanent supportive housing, without reducing homelessness overall. In fact, the supply of temporary shelters is lower today than 10 years ago, and the unsheltered population larger – hinting at a tradeoff between temporary shelter services and more permanent services like those supplied in recent decades. Moreover, this failure has come at the expense of one of the state’s most vulnerable populations – its unhoused ‘literally homeless’.
It is critical that leaders and stakeholders embrace an evidence-based strategy to tackling this crisis, ensuring that continued investment leads to measurable improvements in outcomes while being mindful of the potentially counterproductive incentive structure created by policies that fail to put treatment at the forefront or tackle root causes of homelessness in the first place.
Appendices
Appendix A: Key Terms
Continuum-of-Care – The HUD Continuum-of-Care (COC) Program is “designed to assist sheltered and unsheltered homeless people”[xli]. It is a geographic area established by relevant organizations – state and local government and nonprofits – to fulfill specific HUD homeless program responsibilities, including operating and managing federal data collections systems like the Homeless Management Information System (HMIS) and Point-in-Time counts. Relevantly for this paper, Arizona’s three COC’s together encompass the state’s entire geographic area, and relevant homelessness-related data is generally available by COC.
HUD – The Department of Housing and Urban Development (HUD) is the principle federal agency responsible for “addressing America’s housing needs”[xlii]. As part of the national treatment of homelessness as a housing problem, HUD provides assistance (primarily as grant funding) to state and local governments and nonprofits to provide services for people experiencing homelessness, primarily through its Office of Community Planning and Development (CPD).
Literally Homeless – HUD defines as “literally homeless” (or Homeless Category 1) an “individual who lacks a fixed, regular, and adequate nighttime residence”[xliii]. This population is differentiated from those who may become imminently homeless (Category 2), do not meet the definition but may be otherwise categorized as homeless under federal law (Category 3), and those who are fleeing domestic violence (Category 4). Both the PIT count and this paper attempt to estimate the true and correct “literally homeless” population by COC and within Arizona.
Permanent Supportive Housing – A form of subsidized housing which is permanent (as opposed to shelter housing) in which cost assistance and (voluntary) supportive services are provided. A part of the “housing first” philosophy, Permanent Supportive Housing (PSH) is intended to address the permanent shelter needs of chronically homeless people[xliv]; as such, participants in these programs are not included in the PIT counts.
Point-in-Time Count – As a condition of federal funding, all Continuums of Care are required to a conduct a Point-in-Time (PIT) count of people experiencing homelessness within their jurisdiction. The count typically occurs annually. Though intended to be a complete census of the literally homeless population, some stakeholders allege the PIT undercounts the true annual population.
Shelter – A temporary lodging facility for individuals and families experiencing homelessness, domestic abuse, or other harmful situations rendering their current shelter unsafe. This term often includes emergency shelters, transitional housing facilities, and safe haven programs.
Appendix B: Methodology & Data Notes
Methodology
Expenditures
The expenditure estimates for the homeless serving ecosystem in Arizona can be separated into two parts. The first involves the direct expenditures by the various nonprofit organizations engaged in homelessness-related services in the state. The other category encompasses all the public funding – consisting primarily of state funding – which is spent either directly, or in a pass-through fashion via grants and other processes, often to private, nonprofit organizations.
The annual spending reflects an estimate of the recurring expenditures in the homeless serving ecosystem within Arizona. Because of the complexity related to revenue sources flowing into the ecosystem, total expenditures are captured, not revenue, as to avoid any double counting of funds.
CSI undertook a lengthy process to review each expense to remove any dollars that would be re-granted to other organizations, to ensure no significant double counting occurred. We also removed funding not related to homelessness relief efforts. Ultimately, the total expenses related to homelessness captured in the report are only 22% of total expenses listed for nonprofit agencies included.
- Financial information came from 167 major nonprofit providers including: program service and total expenditures from their latest Forms 990.
- In most cases annual expenditures are for 2021-2022, though several included only had information available for earlier years. Two organizations had information for 2023.
Public spending captured in the total reflect estimates of spending from the State of Arizona as well as local cities and counties. Upper-bound estimates were calculated using all identified public spending, while the low estimates were calculated using only spending on direct services and administrative expenses for homelessness efforts to avoid the double counting of public monies that may flow to nonprofit organizations.
Estimates of Population Served by Expenditures
CSI used a range to capture the homeless related expenditures relative to the number of people being served. This report relied on the best practices identified in CSI Colorado’s homelessness report as it relates to estimation of the actual homeless population. Though there is not a consensus on the best approach, the following three estimates provide a range that covers a daily average, and the total number of people who become homeless, even if just for a brief amount of time. Estimates 1, 2 and 3 show a range in the daily average number of people who are counted as homeless, as well as those in the Homeless Continuum of Care that are housed in permanent supportive housing. They are intended to provide both a lower- and upper-bound on the range of people who may be experiencing homelessness in Arizona and by COC over time, and to capture two alternative measures (both the traditional or ‘literally homeless’ population and a more expansive population including those in permanent supportive housing).
- Estimate 1 – PIT = The total number of individuals experiencing homelessness captured in the annual Point-in-time count.
- Estimate 2 – PIT + 0.98*PSH = The total number of individuals experiencing homelessness captured in the annual Point-in-Time count, plus 98% of the total number of permanent supportive housing units. Analysis by CSI Colorado and CSI Arizona suggests that the vast majority (roughly 98%) of beds listed for PSH programs have an individual assigned to them. Therefore 98% of the number of PSH units serves as an estimate of the total population receiving Permanent Housing services and assistance. Arguably, because individuals in permanent supportive housing are dependent both on housing cost support and other social services to remain housed, without the PSH-bed they would be at high risk of again experiencing homelessness.
- Estimate 3 – PIT*2.5 + 0.98*PSH = Given the PIT count occurs on a single night, CSI Colorado recommended multiplying the PIT count by a factor of 2.5 for an upper-bound estimate of the annualized literally homeless count. According to CSI Colorado, this method for estimating the annual count of people experiencing homelessness is used by Colorado Coalition for the Homeless, St. Francis Center, Urban Peak and other stakeholders. While just an approximation, considering an annual upper-limit count of people experiencing homelessness is helpful in considering the scope of this issue.
Data Notes
Regional assumptions
Each organization’s spending is based on the location of its headquarters. However, if an organization has headquarters in Arizona but also operates outside of the state, we only counted estimated expenditures within the region as described below.
Several steps were taken to share out the total expenditures of some organizations to both just within Arizona and to within the boundaries of the three COCs.
Supporting evidence from financial reports and helped to inform an assumed share of spending among COCs. All assumptions are noted in the list of service providers in Appendix E. As an example, if a permanent housing provider has 2/3 of building locations in a particular COC, then 2/3 of spending would be assumed to occur in that area. In cases where there was not supporting evidence, spending was assumed to be distributed across regions based on the share of individuals experiencing homelessness across regions from the PIT count.
Expenditures Not Captured
The expenditures in this analysis are not comprehensive with regards to capturing every organization that touches the homelessness ecosystem. The figures are collected from a wide range of sources, as there is no reporting requirement among all nonprofits and public agencies to isolate expenditures related to homelessness. The primary known areas not included in this report’s expenditure analysis include the following:
- Additional nonprofit entities – There are other organizations outside of the 167 captured in this report that serve and support the homeless. It may only be a small portion of their organization’s mission and therefore do not isolate their financial commitments to just homelessness-related services.
- Affordable housing authorities – Municipal housing authorities can play a key role in the homelessness ecosystem. While most of their spending is related to low-income housing support, one expert estimated agency expenditures on supportive housing for the current and formerly homeless to be around 20% to 30%, but it would fluctuate by region.
- Health care expenses – Physical and mental health care expenditures provided by hospitals and other health-care facilities were not included in the expenditure calculations, although these organizations often provide services directly to persons experiencing homelessness.
- Criminal enforcement and incarceration spending – Presumably, there are law-enforcement costs associated with the higher incidence of criminal conduct among people experiencing homelessness. Other reports that estimate aggregate costs of homelessness, such as those conducted by CSI Colorado and the Urban Institute in its review of Denver’s Social Impact Bond program, include expenses related to incarceration, courts, and law enforcement. None of these expenses were included in this report.
- Other Public Benefits & Support: State Medicaid and other social welfare programs not explicitly targeting populations experiencing homelessness may nonetheless disproportionately benefit this population or otherwise provide homelessness-related services. For example, stakeholders flagged that elements of “Permanent Supportive Housing” may be funded in part by low-income housing tax credits (the LIHTC program administered by the state’s Housing Department but not directly captured in this report), Medicaid, and other funding streams.
Appendix C: Full List of Charitable Organizations
[1] Permanent Supportive Housing is permanent or long-term supportive services offered to individuals who, by definition, are not “homeless”. However, we include this population throughout because it is part of the public-services-based approach to addressing homelessness and is a “Housing First” principle.
[i] Wiles, Russ, and Agnel, Philip “Who’s hiring in Arizona? These are the state’s 100 largest employers” AZ Central.
[ii] Brown, Chris, Summers, D.J., and Tartaglia, Ethan “A Snapshot of the Metro Denver Homeless Ecosystem in 2023,” Common Sense Institute Colorado, October 2023.
[iii] Economy of Arizona, Wikipedia, January 17, 2024.
[iv] Gross Domestic Product: Farms (111-112) in Arizona, Federal Reserve Bank of St. Louis.
[v] Corinth, Kevin, “Our Policies to Address Homelessness are Failing,” American Enterprise Institute, December 2. 2023.
[vi] “PIT and HIC Data Since 2007” U.S. Department of Housing and Urban Development, December 2023.
[vii] “Reinstating Governor’s Arizona Commission on Homelessness and Housing as Governor’s Interagency and Community Council on Homelessness and Housing,” Arizona Office of the Governor, January 6, 2023.
[viii] Mosel, Stacy, “Substance Abuse and Homelessness: Statistics and Rehab Treatment,” American Addiction Centers, January 3, 2024.
[ix] Martell, DA, Rosner, R, and Harmon R.B., “Base-rate Estimates of Criminal Behavior by homeless Mentally Ill Persons in New York City,” National Library of Medicine, June 1995.
[x] “National Homeless Mortality Overview,” National Health Care for the Homeless Council, 2020.
[xi] “PIT and HIC Data Since 2007” U.S. Department of Housing and Urban Development, December 2023.
[xii] Farley, Glenn, “Fentanyl, Crime, and Arizona’s Southern Border: August 2022,” Common Sense Institute Arizona, August 24, 2022.
[xiii] Farley, Glenn, “Failure to Launch: The Social and Economic Impacts of K-12 Learning Loss Since 2020,” Common Sense Institute Arizona, September 12, 2023.
[xiv] Chapman, Mia, “What is Permanent Supportive Housing?,” National League of Cities, January, 31, 2024.
[xv] “Maricopa County Office of the Medical Examiner 2022 Annual Report,” Maricopa County, 2022.
[xvi] Lum, Justin, “Crimes of ‘the Zone’: Theft, Assaults, Drugs, Unsanitary Conditions Plague Area of Downtown Pheonix Tent City,” Fox 10 Phoenix, September 15, 2022.
[xvii] Edelman, Hannah, “Homelessness and Addiction Are Intertwined. How State, Local Organizations Plans to Help,” Delaware News Journal, January 26, 2024.
[xviii] Camhi, Tiffany, “How Fentanyl and Social Isolation Have Worsened Youth Homelessness Crisis in Oregon,” Oregon Public Broadcasting, January 25, 2024.
[xix] “Medical Examiner Annual Report: 2022,” Maricopa County Office of the Medical Examiner”, May 2023.
[xx] Meinbresse, Molly, Brinkley-Rubinstein, Lauren, Grassette, Amy, Benson, Joseph, Hall, Coral, Hamilton, Reginald, Marlot, Marianne, Jenkins, Darlene. “Exploring the Experiences of Violence Among Individuals Who Are Homeless Using a Consumer-Led Approach,” Violence and Victims, Column 29 Number 1, 2014, National Health Care for the Homeless Council, 2014.
[xxi] Thomas, Alexandra, and Tapp, Susannah, “Criminal Victimization, 2022,” U.S. Department of Justice, September 2023.
[xxii] Schmid, Thacher, “Homeless Homicides Are On the Rise,” The Nation, March 14, 2023.
[xxiii] “Reducing Street Homelessness”, Cicero Institute, 2023.
[xxiv] Fritsky, Lauren, “Humanely Mitigating the Impact of Homelessness on Retail Stores,” Loss Prevention Magazine, January 24, 2024.
[xxv] Superior Court of Arizona, Maricopa County, See Brown, et al. v. City of Phoenix, CV 2022-010439, Clerk of the Court, 2023.
[xxvi] Rummel, Rihl, “As more of ‘The Zone’ in Phoenix is cleared, are fewer unhoused people living in the area?”, AZ Central, August 2, 2023.
[xxvii] Rihl, Juliette, “ACLU sues Phoenix over homeless sweeps, citations”, AZ Central, December 1, 2022.
[xxviii] Kurtz, Devon, “Solutions First,” City Journal, August 23, 2023.
[xxix] McEvers, Kelly , “Utah Reduced Chronic Homelessness by 91 percent; Here’s How,” National Public Radio, December 10, 2015.
[xxx] Thompson, Steve, “D.C. Does Little When Some in Supportive Housing Behave Dangerously,” The Washington Post, December 12, 2023.
[xxxi] Schwenk, Katya, “Phoenix Spars With Business Owners in Court Over Massive Homeless Encampment,” Phoenix New Times, November 2, 2022.
[xxxii] Culhane, Dennis, “The Costs of Homelessness: A Perspective from the United States,” University of Pennsylvania, January 1, 2008.
[xxxiii] Richards, Jessica, Kuhn, Randall, “Unsheltered Homelessness and Health: A Literature Review,” National Library of Medicine, October 29, 2022.
[xxxiv] “HUD Awards and Allocations,” U.S. Department of Housing and Urban Development, 2022.
[xxxv] Arizona Joint Legislative Budget Committee, FY 2022 Appropriations Report, August 6, 2021.
[xxxvi] Arizona Joint Legislative Budget Committee, FY 2024 Appropriations Report, July 12, 2023.
[xxxvii] “Phoenix, AZ Rental Market,” Zillow, February 6, 2024.
[xxxviii] “Housing First,” National Alliance to End Homelessness, March 20, 2022.
[xxxix] Janey Rountree, Nathan Hess, and Austin Lyke, “Health Conditions Among Unsheltered Adults in the U.S.,” California Policy Lab Policy Brief, October 2019.
[xl] Janey Rountree, Nathan Hess, and Austin Lyke, “Health Conditions Among Unsheltered Adults in the U.S.,” California Policy Lab Policy Brief, October 2019.
[xli] “Introductory Guide to the Continuum of Care (CoC) Program,” U.S. Department of Housing and Urban Development, July 14, 2012.
[xlii] “Questions and Answers About HUD” U.S. Department of Housing and Urban Development, February 8, 2024.
[xliii] “CoC and ESG Homeless Eligibility – Category 1: Literally Homeless,” U.S. Department of Housing and Urban Development, February 8, 2024.
[xliv] “Permanent Supportive Housing,” National Alliance to End Homelessness, April 2023.