

Consumer prices in the United States rose again in February, by 7.9% over the last 12 months – its highest rate in over forty years. At 10.9%, price inflation in the Phoenix metropolitan area remained both well above the national average and at the highest levels ever recorded for the city. Since October of last year, prices in Phoenix have been rising at an average rate of more than 1% per month. Price increases are concentrated in transportation, housing and food costs – with gasoline alone costing the average household $597 more since the current inflation crisis began last year, than it would have at 2020 average prices.
Inflation in Metro Phoenix was 2.1% between December ‘21 and February and 10.9% over the Last 12 Months – Feb ’21 through Feb ’22 – (BLS CPI Survey)
- Average annual inflation between 2010 and 2019 was 2.0%.
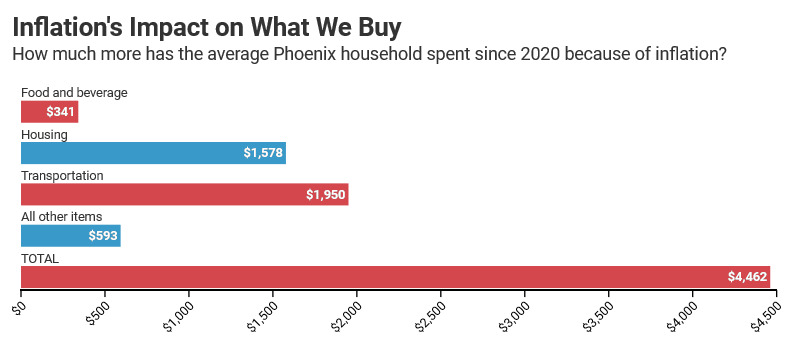
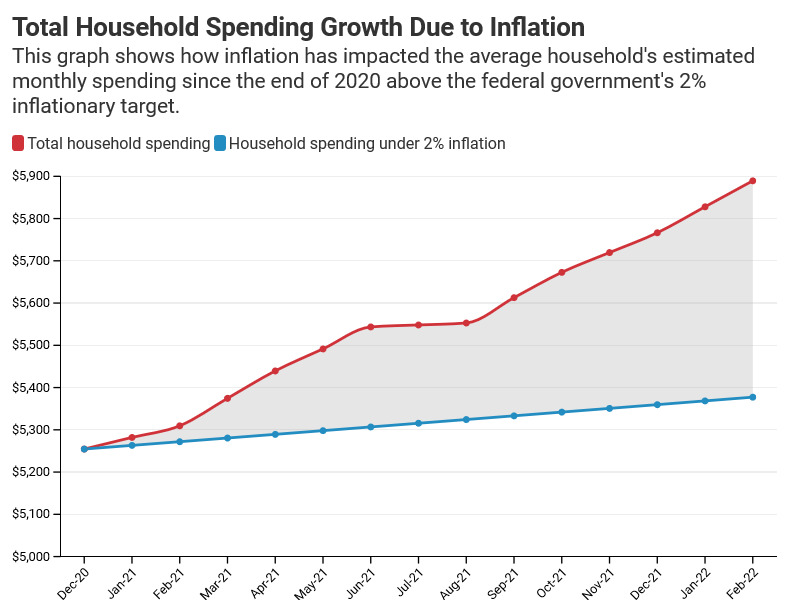
- The typical Arizona household has spent a combined $4,462 more on food, housing, transportation, medical care, and other goods and services since the end of 2020.[i]
- Together, the increase in the cost of food, housing, and gasoline accounts for nearly 60% of this increase.[ii]
- Inflation in metro Phoenix over the past 12 months was 3.0 percentage points higher than the national average of 7.9%.
- Inflation has been consistently high since spiking in the first quarter of 2021. Early suggestions that these price increases would be transitory have proved wrong.
- Of the 23 urban consumer price indices tracked by the BLS, the Phoenix metro area had the highest rate of inflation over the past year.
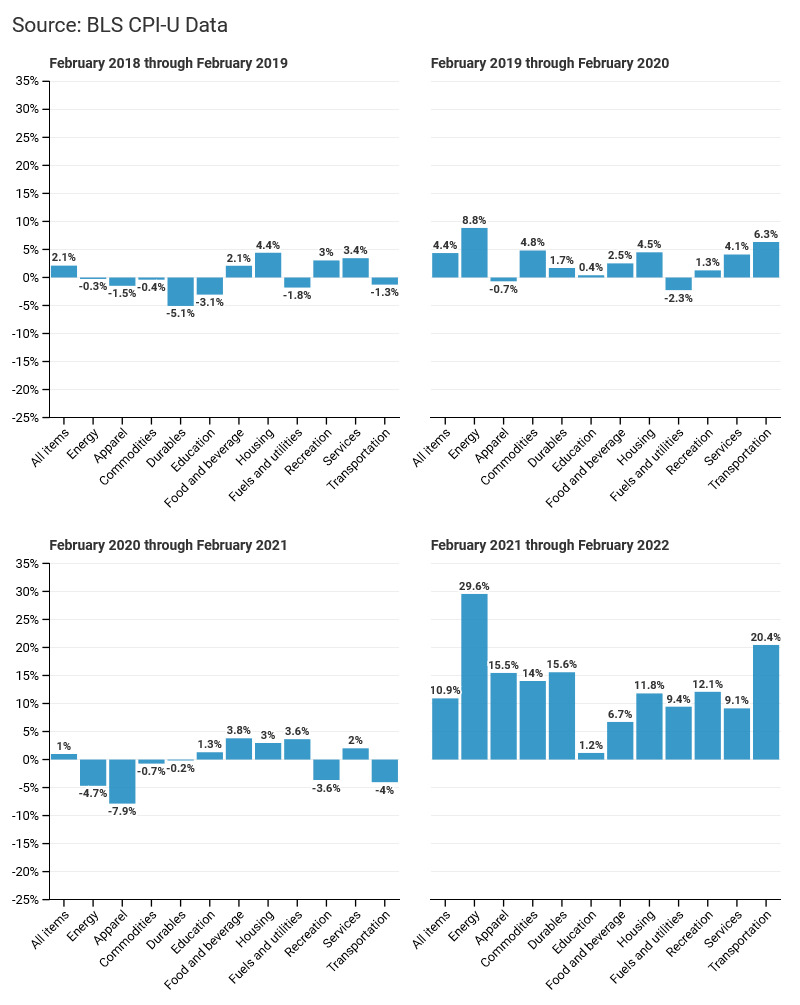
- The two price categories that grew the fastest over the last 12 months were motor vehicle fuel and energy, which grew by 44.0% and 29.6%, respectively.
- Rents and the cost of housing in the Phoenix metro area grew by 12.4% over the past 12 months – 2.6 times the rate for the United States as a whole, according to the Bureau of Labor Statistics.
- Producer prices – which tend to lead consumer prices – are rising even faster than CPI, and the Ukraine crisis and American response to it are likely to put further pressure on commodity, energy, and gas prices. For these reasons we believe further upward consumer price movement is likely over the next 3-6 months, rather than an easing.
Price Changes in Metro Phoenix over the Previous Year
© 2022 Common Sense Institute
[i] This figure corresponds to the data in the first graph. These are generated by distributing the consumer expenditure estimates from https://www.bls.gov/cex/tables/geographic/mean/cu-msa-west-2-year-average-2020.pdf across the individual months of 2020 and weighting them according to their corresponding CPI levels. We then assume that any price changes since January 2021 have resulted in increased costs relative to this average 2020 price level.
[ii] https://www.bls.gov/regions/mountain-plains/news-release/consumerexpenditures_denver.htm